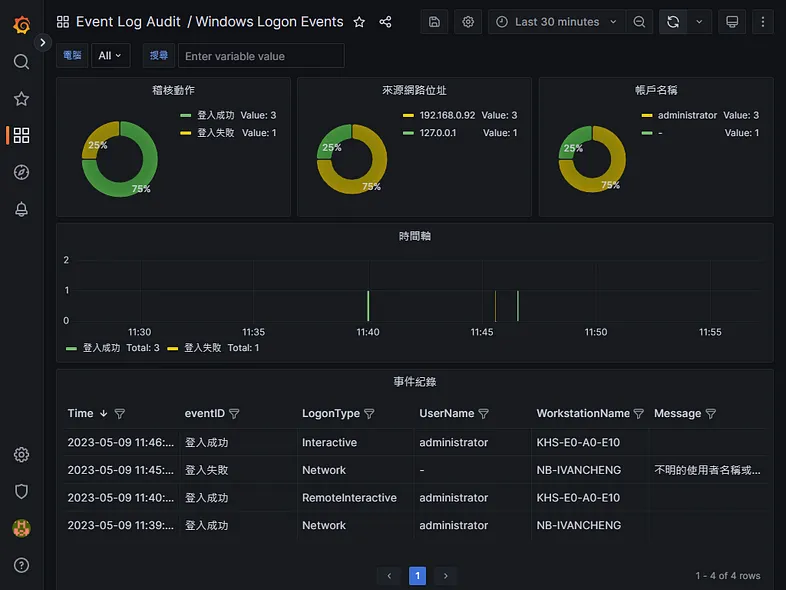
由於 Grafana 多樣的面板選擇,我們經常使用 Grafana 將採集到的監控數據進行多種視覺化的呈現,並透過時間序列的方式進行分析。
但是 Grafana Community 版本沒有辦法將 Dashboard 以 PDF 格式直接產生報告。該功能只有 Grafana Cloud Pro、Grafana Cloud Advanced 以及 Grafana Enterprise 有支援。
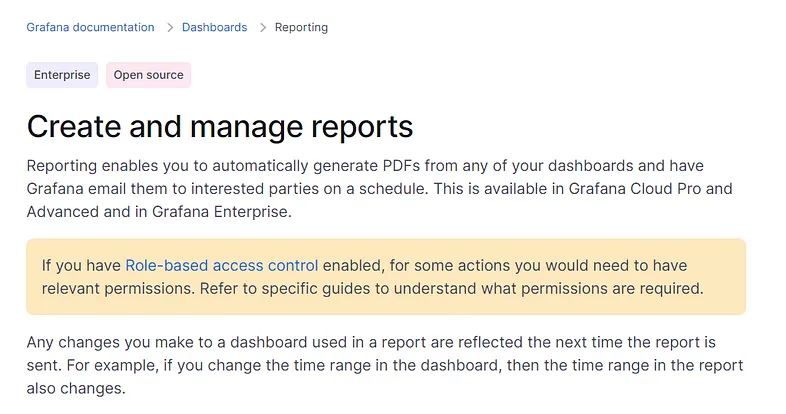
若您只想要在本地運行 Grafana 的話,那就只剩 Grafana Enterprise 可以考慮。官方網站並沒有提供 Grafana Enterprise 的價格,目前只能透過電話與業務代表聯繫,據說每年至少要 40,000 美金。

今天就來教大家如何透過郵件自動發送 Grafana 儀表板報告吧。
Export Dashboard as PDF
還好網路上已經有大神幫我們實現了,直接拿來使用就可以。
https://github.com/IzakMarais/reporter
若還沒安裝 Docker 的朋友,可以參考這篇文章。
https://medium.com/@jieshiun/%E5%A6%82%E4%BD%95%E5%9C%A8-ubuntu-20-04-%E5%AE%89%E8%A3%9D-docker-%E8%88%87-docker-compose-27a88b3d746b
我們透過下列指令建置容器
sudo docker run -d -p 8686:8686 --net="host" --name grafana-reporter --restart=always izakmarais/grafana-reporter
打開瀏覽器確認一下 8686 埠號,正常畫面如下。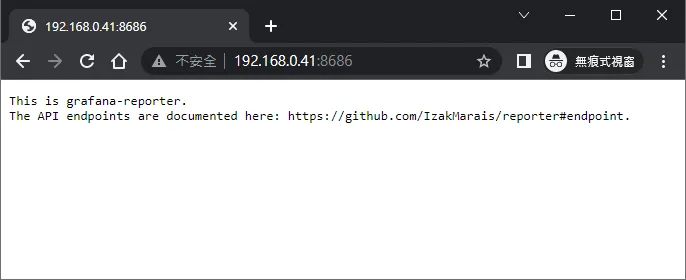
回到 Grafana 儀表板的設定,新增一筆 Links 如下。
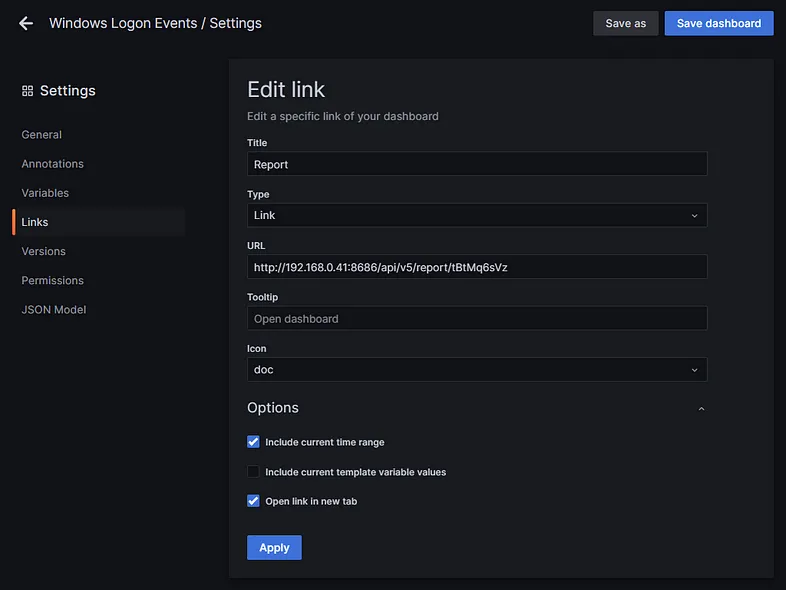
儀表板的右上方就會多一個 Report 的連結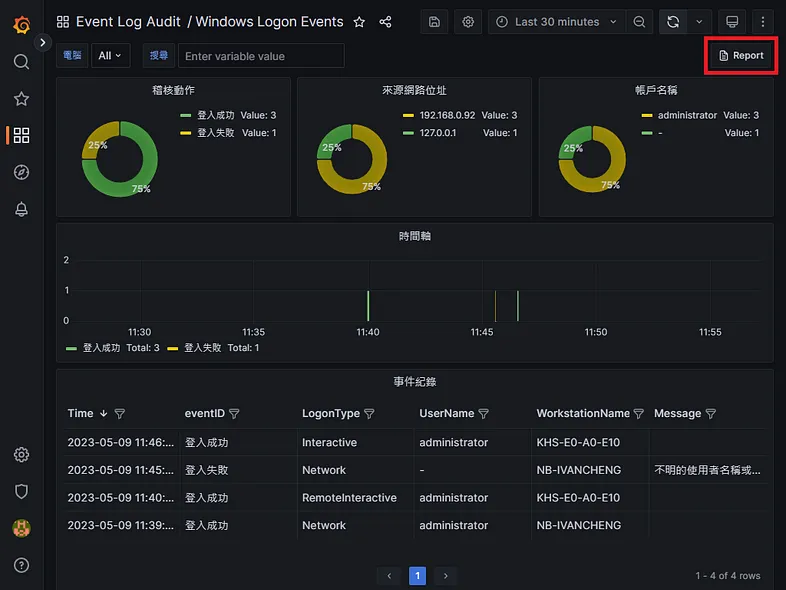
點選該連結,就會以 PDF 格式產生報告。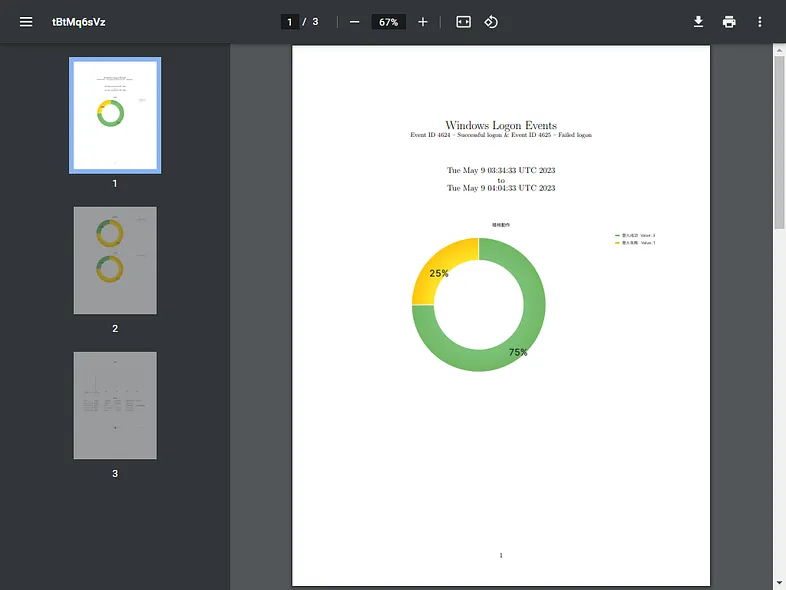
可以在儀表板的一般資訊維護報表的名稱與描述。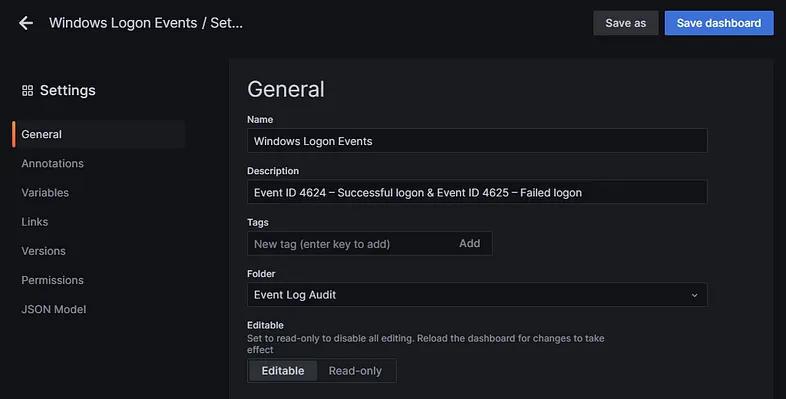
若想要自動產生報告,就必須下載程式碼並使用指令模式。
必要條件
我們需要先安裝 Grafana 圖像渲染器外掛
sudo grafana-cli plugins install grafana-image-renderer
✔ Downloaded and extracted grafana-image-renderer v3.7.0 zip successfully to /var/lib/grafana/plugins/grafana-image-renderer

Please restart Grafana after installing plugins. Refer to Grafana documentation for instructions if necessary.
記得重啟 Grafana 服務
sudo service grafana-server restart
隨便找一個 Panel 右鍵點選 Share,點選 Direct link rendered image。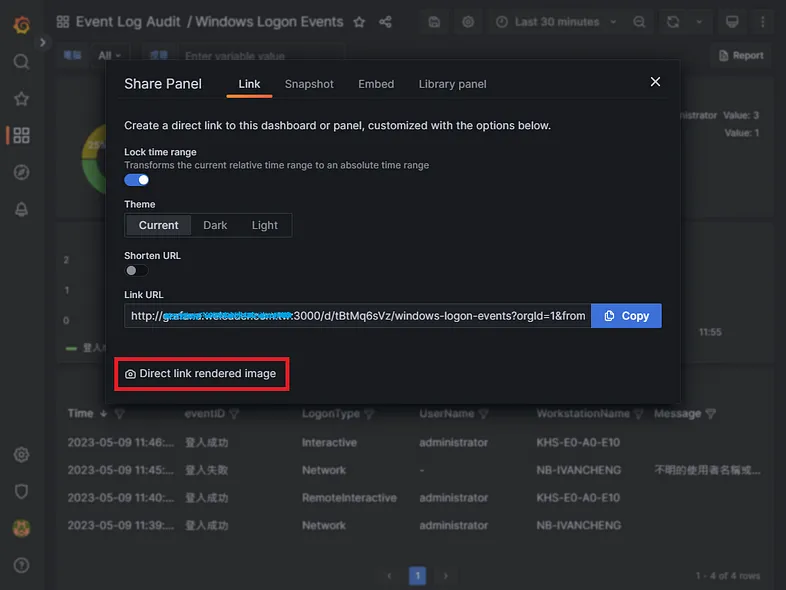
若渲染發生錯誤提示如下
logger=plugin.grafana-image-renderer t=2023-05-05T11:54:51.675605095+08:00 level=error msg="Render request failed" url="http://localhost:3000/d-solo/TaRQ7YyVk/windows-logon-events?orgId=1&from=1683255284739&to=1683258884739&panelId=14&width=1000&height=500&tz=Asia%2FTaipei&render=1" error="Error: Failed to launch the browser process!\n/var/lib/grafana/plugins/grafana-image-renderer/chrome-linux/chrome: error while loading shared libraries: libatk-1.0.so.0: cannot open shared object file: No such file or directory\n\n\nTROUBLESHOOTING: https://github.com/puppeteer/puppeteer/blob/main/docs/troubleshooting.md\n"
透過下面指令安裝缺少的套件
sudo apt-get install libatk1.0-0 libatk-bridge2.0-0 libcups2 libxkbcommon-x11-0 libxcomposite1 libxdamage1 libxfixes3 libxrandr2 libgbm1 libpango-1.0-0 libcairo2
安裝 Latex 套件,產生 PDF 的時候會使用到。
sudo apt install texlive-latex-extra
由於程式碼是用 Go 開發的,所以還需要能夠執行 Go。
curl -OL https://golang.org/dl/go1.16.7.linux-amd64.tar.gz
sudo tar -C /usr/local -xvf go1.16.7.linux-amd64.tar.gz
設置 Go 路徑
sudo nano ~/.profile
在文件底部添加如下
export PATH=$PATH:/usr/local/go/bin
檢查是否可以運行 go version
source ~/.profile
go version
go version go1.16.7 linux/amd64
運行程式碼
下載 IzakMarais/reporter 程式碼
go get github.com/IzakMarais/reporter/...
查詢程式支援那些參數
./go/bin/grafana-reporter --help
Usage of ./go/bin/grafana-reporter:
  -cmd_apiKey string
     Grafana api key. Required (and only used) in command line mode.
  -cmd_apiVersion string
     Api version: [v4, v5]. Required (and only used) in command line mode, example: -apiVersion v5. (default "v5")
  -cmd_dashboard string
     Dashboard identifier. Required (and only used) in command line mode.
  -cmd_enable
     Enable command line mode. Generate report from command line without starting webserver (-cmd_enable=1).
  -cmd_o string
     Output file. Required (and only used) in command line mode. (default "out.pdf")
  -cmd_template string
     Specify a custom TeX template file. Only used in command line mode, but is optional even there.
  -cmd_ts string
     Time span. Required (and only used) in command line mode. (default "from=now-3h&to=now")
  -grid-layout
     Enable grid layout (-grid-layout=1). Panel width and height will be calculated based off Grafana gridPos width and height.
  -ip string
     Grafana IP and port. (default "localhost:3000")
  -port string
     Port to serve on. (default ":8686")
  -proto string
     Grafana Protocol. Change to 'https://' if Grafana is using https. Reporter will still serve http. (default "http://")
  -ssl-check
     Check the SSL issuer and validity. Set this to false if your Grafana serves https using an unverified, self-signed certificate. (default true)
  -templates string
     Directory for custom TeX templates. (default "templates/")
新增一組 API Key 才能透過 API 存取 Grafana 的儀錶板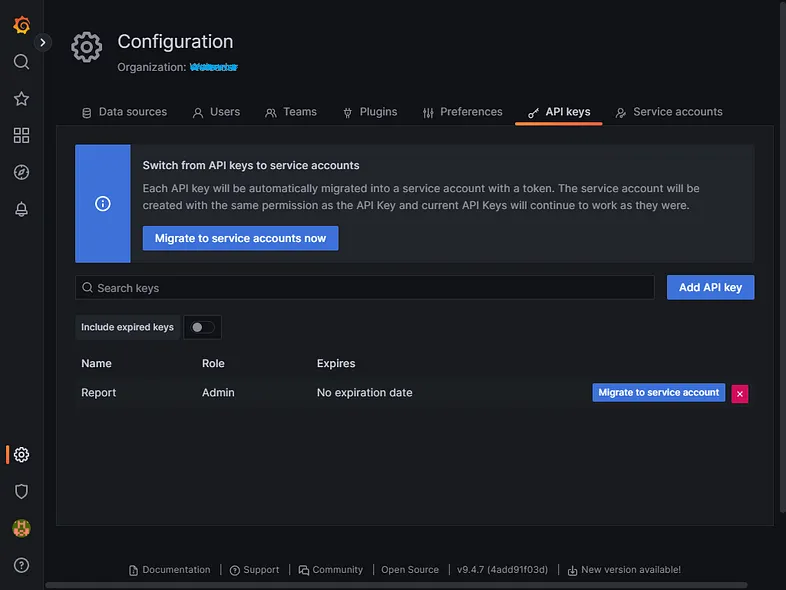
使用下列指令產生 PDF 報告
./go/bin/grafana-reporter \
    -cmd_enable=1 \
    -cmd_apiKey your_api_key \
    -ip localhost:3000 \
    -cmd_dashboard your_dashboard_id \
    -cmd_ts from=now-30m \
    -grid-layout \
    -cmd_o output.pdf
2023/05/09 11:57:31 grafana reporter, version: 2.3-1 hash: 6cfc3e220dc4f8fc0175ae0ec8698d35546d8c10
2023/05/09 11:57:31 serving at ':8686' and using grafana at 'http://localhost:3000'
2023/05/09 11:57:31 SSL check enforced
2023/05/09 11:57:31 Using grid layout.
2023/05/09 11:57:31 Called with command line mode enabled, will save report to file and exit.
2023/05/09 11:57:31 Called with command line mode 'dashboard' 'tBtMq6sVz'
2023/05/09 11:57:31 Called with command line mode 'apiKey' 'eyJrIjoiOUV1dlFnTFVobVB3U2FkUXdsYjZ5djk3cTZ4MkNHdmoiLCJuIjoiUmVwb3J0IiwiaWQiOjF9'
2023/05/09 11:57:31 Called with command line mode 'apiVersion' 'v5'
2023/05/09 11:57:31 Called with command line mode 'outputFile' 'output.pdf'
2023/05/09 11:57:31 Called with command line mode 'timeSpan' 'from=now-30m'
2023/05/09 11:57:31 Reporter called
2023/05/09 11:57:31 Called with api Token: eyJrIjoiOUV1dlFnTFVobVB3U2FkUXdsYjZ5djk3cTZ4MkNHdmoiLCJuIjoiUmVwb3J0IiwiaWQiOjF9
2023/05/09 11:57:31 Called without variable
2023/05/09 11:57:31 Called with dashboard: tBtMq6sVz
2023/05/09 11:57:31 Called with time range: {now-30m now}
2023/05/09 11:57:31 Connecting to dashboard at http://localhost:3000/api/dashboards/uid/tBtMq6sVz
2023/05/09 11:57:31 Populated dashboard datastructure: {Title:Windows Logon Events Description:Event ID 4624 – Successful logon \& Event ID 4625 – Failed logon VariableValues: Rows:[] Panels:[{Id:6 Type:piechart Title:稽核動作 GridPos:{H:5 W:8 X:0 Y:0}} {Id:10 Type:piechart Title:來源網路位址 GridPos:{H:5 W:8 X:8 Y:0}} {Id:11 Type:piechart Title:帳戶名稱 GridPos:{H:5 W:8 X:16 Y:0}} {Id:12 Type:timeseries Title:時間軸 GridPos:{H:5 W:24 X:0 Y:5}} {Id:16 Type:table Title:事件紀錄 GridPos:{H:8 W:24 X:0 Y:10}}]}
2023/05/09 11:57:31 Downloading image  10 http://localhost:3000/render/d-solo/tBtMq6sVz/_?from=now-30m&height=200&panelId=10&theme=light&to=now&width=320
2023/05/09 11:57:31 Downloading image  6 http://localhost:3000/render/d-solo/tBtMq6sVz/_?from=now-30m&height=200&panelId=6&theme=light&to=now&width=320
2023/05/09 11:57:31 Downloading image  11 http://localhost:3000/render/d-solo/tBtMq6sVz/_?from=now-30m&height=200&panelId=11&theme=light&to=now&width=320
2023/05/09 11:57:31 Downloading image  12 http://localhost:3000/render/d-solo/tBtMq6sVz/_?from=now-30m&height=200&panelId=12&theme=light&to=now&width=960
2023/05/09 11:57:31 Downloading image  16 http://localhost:3000/render/d-solo/tBtMq6sVz/_?from=now-30m&height=320&panelId=16&theme=light&to=now&width=960
2023/05/09 11:57:42 Calling LaTeX - preprocessing
2023/05/09 11:57:43 Calling LaTeX and building PDF
2023/05/09 11:57:43 Extracted filename from dashboard title:  Windows Logon Events.pdf
2023/05/09 11:57:43 Report generated correctly
產出的報告畫面如下,LaTeX 的排版看起來就是舒服。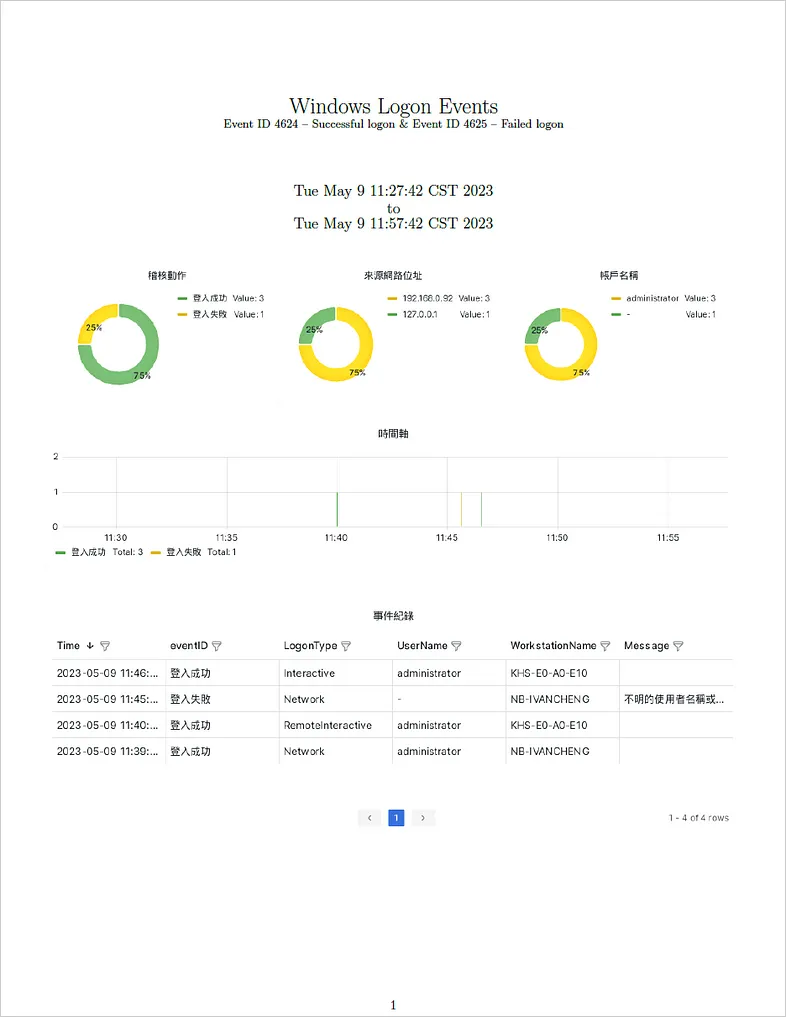
郵件發送
若您沒有 SMTP 伺服器請參考下篇文章進行建置,接下來的配置我們會需要使用 SMTP 服務來發送郵件。
https://medium.com/@jieshiun/%E5%A6%82%E4%BD%95%E5%9C%A8-azure-%E8%A8%AD%E5%AE%9A-sendgrid-smtp-%E7%99%BC%E4%BF%A1-f02ab6074f2d
我們打算使用 PHPMailer 來發送電子郵件,先安裝需要的套件。
sudo apt-get install php libphp-phpmailer sendmail
檢查是否可以運行 php version
php -v
PHP 7.4.3-4ubuntu2.18 (cli) (built: Feb 23 2023 12:43:23) ( NTS )
Copyright (c) The PHP Group
Zend Engine v3.4.0, Copyright (c) Zend Technologies
    with Zend OPcache v7.4.3-4ubuntu2.18, Copyright (c), by Zend Technologies
撰寫發送郵件程式
vi sendmail.php
添加程式碼如下
<?php
    require '/usr/share/php/libphp-phpmailer/autoload.php';

    $mail = new PHPMailer\PHPMailer\PHPMailer();

    $mail->IsSMTP(); // enable SMTP
    $mail->SMTPDebug = 1; // debugging: 1 = errors and messages, 2 = messages only
    $mail->SMTPAuth = true; // authentication enabled
    $mail->SMTPSecure = 'ssl'; // secure transfer enabled REQUIRED for Gmail
    $mail->Host = "smtp.sendgrid.net";
    $mail->Port = 465;
    $mail->IsHTML(true);
    $mail->Username = "apikey";
    $mail->Password = "your_api_password";

    $mail->From = "your_sender_email";
    $mail->FromName = "your_sender_name";
    $mail->addAddress("your_receiver_email", "your_receiver_name");
    $mail->isHTML(true);
    $mail->Subject = "Daily Login Report";
    $mail->Body = "Attached is the report you requested.";

    $mail->addAttachment("output.pdf");

    if(!$mail->send())
    {
        echo "Mailer Error: ". $mail->ErrorInfo ."\n";
    }
    else
    {
        echo "Message has been sent successfully\n";
    }
?>
執行發送郵件程式
php sendmail.php
2023-05-09 06:22:27 CLIENT -> SERVER: DZ0abrJXj6/+VFERNwplbmRzdHJlYW0KZW5kb2JqCnN0YXJ0eHJlZgoxMDcwMDUKJSVFT0YK
2023-05-09 06:22:27 CLIENT -> SERVER:
2023-05-09 06:22:27 CLIENT -> SERVER: --b1_WCynrK2YnT6KWPU9VqQw612SZR4YK561U0xvh0tXg--
2023-05-09 06:22:27 CLIENT -> SERVER:
2023-05-09 06:22:27 CLIENT -> SERVER: .
2023-05-09 06:22:28 CLIENT -> SERVER: QUIT
Message has been sent successfully
郵件寄出成功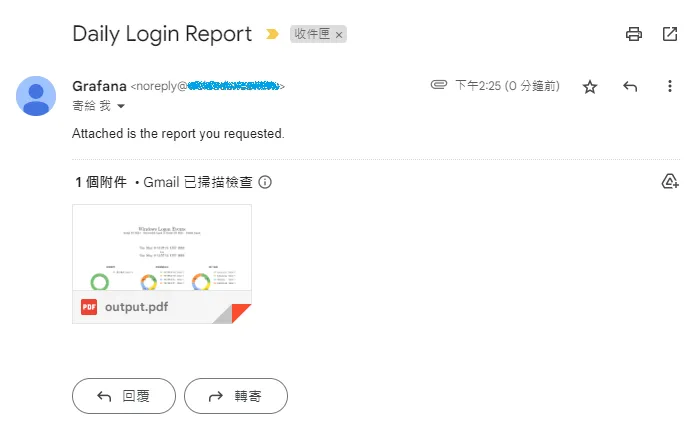
自動發送
我們希望每天上午都能收到發送前一天的報告,撰寫執行腳本把產生報告跟發送郵件串起來。
vi grafana-reporter.sh
#!/bin/bash

cd /home/administrator

filename=`date +%Y-%m-%d -d "yesterday"`.pdf

./go/bin/grafana-reporter \
    -cmd_enable=1 \
    -cmd_apiKey your_api_key \
    -ip localhost:3000 \
    -cmd_dashboard your_dashboard_id \
    -cmd_ts from=now-24h \
    -grid-layout \
    -cmd_o $filename

if test -f "$filename"; then
    php sendmail.php
fi
編輯發送郵件程式,修改附件檔名。
<?php
    require '/usr/share/php/libphp-phpmailer/autoload.php';

    $mail = new PHPMailer\PHPMailer\PHPMailer();

    $mail->IsSMTP(); // enable SMTP
    $mail->SMTPDebug = 1; // debugging: 1 = errors and messages, 2 = messages only
    $mail->SMTPAuth = true; // authentication enabled
    $mail->SMTPSecure = 'ssl'; // secure transfer enabled REQUIRED for Gmail
    $mail->Host = "smtp.sendgrid.net";
    $mail->Port = 465;
    $mail->IsHTML(true);
    $mail->Username = "apikey";
    $mail->Password = "your_api_password";

    $mail->From = "your_sender_email";
    $mail->FromName = "your_sender_name";
    $mail->addAddress("your_receiver_email", "your_receiver_name");
    $mail->isHTML(true);
    $mail->Subject = "Daily Login Report";
    $mail->Body = "Attached is the report you requested.";

    $filename = date('Y-m-d', strtotime('-1 day', time())).".pdf";
    $mail->addAttachment($filename);

    if(!$mail->send())
    {
        echo "Mailer Error: ". $mail->ErrorInfo ."\n";
    }
    else
    {
        echo "Message has been sent successfully\n";
    }
?>
賦予腳本執行權限並執行
chmod +x grafana-reporter.sh
./grafana-reporter.sh
確認運行正常的話,就可以放入排程了。
sudo crontab -e
設定每天上午八點半進行寄送報告
# For example, you can run a backup of all your user accounts
# at 5 a.m every week with:
# 0 5 * * 1 tar -zcf /var/backups/home.tgz /home/
#
# For more information see the manual pages of crontab(5) and cron(8)
#
# m h  dom mon dow   command

30 8  * * * /home/administrator/grafana-reporter.sh > /tmp/grafana-reporter.log
相信大家已經學會了如何透過郵件自動發送 Grafana 儀表板報告
我們 Dashboard 的資料來源是 Grafana Loki,若對 Loki 不熟的朋友可以參考下列文章。
https://medium.com/@jieshiun/%E6%89%8B%E6%8A%8A%E6%89%8B%E6%95%99%E4%BD%A0-grafana-loki-%E5%BE%9E%E5%85%A5%E9%96%80%E5%88%B0%E7%B2%BE%E9%80%9A-feab84c209f0
最後附上整體的架構圖,感謝收看。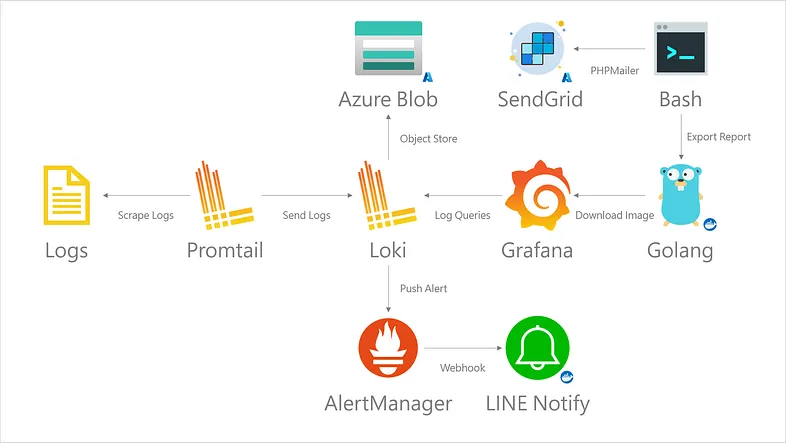
參考文件
 Ivan Cheng
