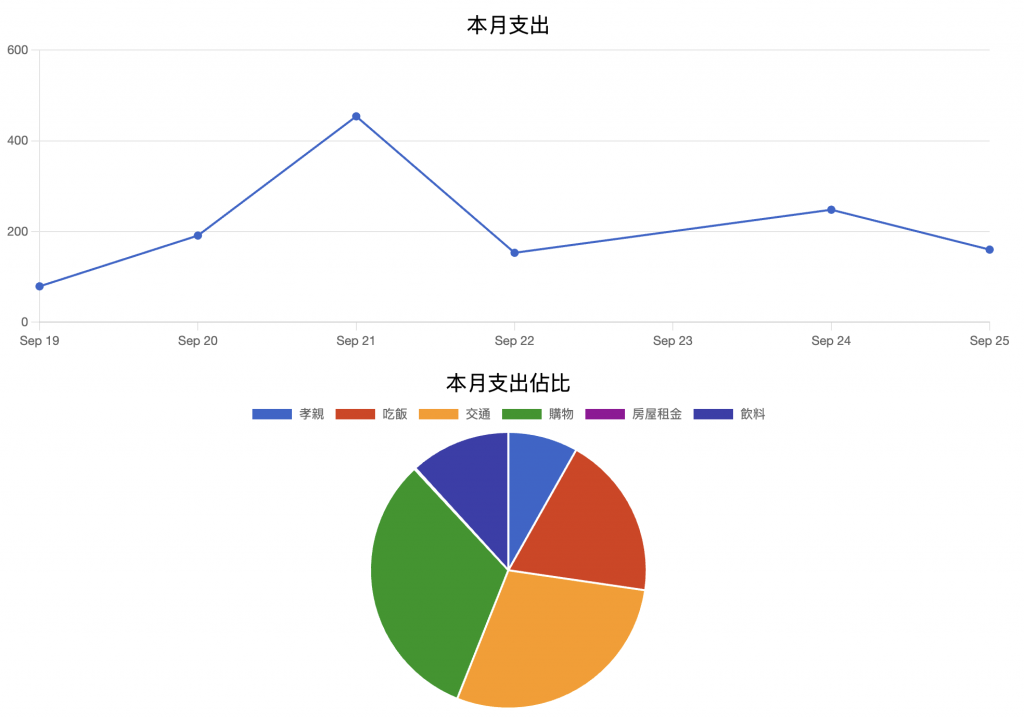
在能夠正常使用記帳的功能後,就能建立數據庫並對這些數據加以分析理解自己的消費習慣
但一整串資料如何分析,如何看穿消費習慣的「形狀」,好則維持,壞則改呢?
最簡單的方式就是進行資料整理的視覺化,了解金流的進出看出趨勢
沒錯!所以這一步要來做視覺化
套件太香了,這次要用的是 Chartkick
就可以使用包裝好的 Helper 快速套入資料顯示圖型
也就是說,你只需要備妥後端的資料,你就能得到各式各樣的圖表
另外,這次是使用 Rails7 的 ImportMap,所以要注意安裝方式
# config/importmap.rb

...
pin "chartkick", to: "chartkick.js"
pin "Chart.bundle", to: "Chart.bundle.js"
# app/javascript/application.js

...
import "chartkick"
import "Chart.bundle"
預計呈現長條圓餅各一張,內容顯示的是這個月的支出總額跟各項佔比
所以會分成兩塊準備,都挑出這個月支出的部分
再按兩個圖表所需去調整統計的方式
# app/controllers/accountings_controller.rb

class AccountingsController < ApplicationController

  def chart
    current_month_accountings = accountings_data.expenditure
                                                .by_range(Date.current.all_month)
    @line_data =
      current_month_accountings.group_by { |accounting| accounting.created_at.to_date }
                              .transform_values { |accountings| accountings.pluck(:amount).sum }
    @pie_data =
      current_month_accountings.group_by(&:name)
                              .transform_values { |accountings| daily_sum(accountings) }
  end

  ...
  private

  def accountings_data
    # 這裡是抽給 index / chart 一起用的
    current_user.accountings
                .includes(:ledger)
                .order(created_at: :desc)
  end
end
# app/models/accounting.rb

class Accounting < ApplicationRecord
  ...

  scope :by_range, ->(range) do
    where("created_at BETWEEN ? AND ?",  range.begin, range.end)
    .order(created_at: :desc)
  end

  ...
end
接下來就簡單設計樣式就行了
# app/views/accountings/chart.html.erb

<div class="bg-white p-4 grid gap-4">
  <div>
    <div class="text-black text-xl text-center">本月收支</div>
    <%= line_chart @line_data, curve: false %>
  </div>

  <div>
    <div class="text-black text-xl text-center">本月支出佔比</div>
    <%= pie_chart @pie_data %>
  </div>
</div>
這樣就有圓餅圖與長條圖呈現了

圖表很簡陋,但我們是 MVP,先有基本出來即可,若後續上線後還有時間可再回頭處理
下一步則要接續處理驗證的部分 GoGoGo
