
在 Kubernetes 生態系中,當我們提及包含 "operator" 字眼的服務時,多數都與 CRD (自定義資源定義) 有著密切的關係。Grafana Agent Operator 不僅自帶其特定的 CRD,而且與 Prometheus Operator 有著深厚的聯繫。事實上,它可以完整地兼容 Prometheus Operator 的所有 CRD。更值得注意的是,Grafana Agent Operator 目前仍是 Grafana LGTM 相關 Helm chart 的預設數據收集器。因此,我們必須對其有深入的了解。

Grafana Agent Operator 作為 Grafana Agent 的 Kubernetes Operator,專為靜態模式而設計。此 Operator 能夠簡化在 Kubernetes 環境中部署和配置靜態模式的流程,從而更有效地從 Kubernetes 資源中收集遙測數據。
主要的遙測收集方式包括:
總結來說,Grafana Agent Operator 利用額外的自定義資源來管理和配置 Static mode 下運行的 Grafana Agent,並協調所有自定義資源類型,並生成 Grafana Agent 的最終配置文件。
注意:Grafana Agent Operator 不支援收集 Traces。
| 自定義資源 | 描述 |
|---|---|
| GrafanaAgent | 發現一項或多項 Metrics Instance、Log sInstance 資源。 |
| MetricsInstance | 定義將收集的指標發送到何處。這將建立一個 Grafana Agent StatefulSet,它將抓取指標並將其發送到 remote_write 端點。 |
| LogsInstance | 定義將收集的日誌發送到何處。這將建立一個 Grafana Agent DaemonSet,它將跟踪集群節點上的日誌文件。 |
| PodLogs | 從 Kubernetes Pod 收集容器日誌。這將配置 LogsInstance / Agent DaemonSet。 |
| Integration | 藉由已存在 Metrics Instance 來來抓取和發送指標,不需運行特定的 exporter 或手動編寫 scrape_configs |
GrafanaAgent 資源是 Grafana Agent Operator CRD 層級結構的核心。它是 Grafana Agent Operator 主要搜尋的資源,且因其能發現其他的子資源 — MetricsInstance、LogsInstance、Integration,因此被稱作層級結構的「根」。
GrafanaAgent 不僅提供在其規範中定義的 Pod 屬性(如 Pod 的請求、限制、親和性和容忍度)給這些子資源,而且也明確指定了 Grafana Agent 的 Image 版本。需要注意的是,只能在 GrafanaAgent 層級上定義 Pod 屬性,而這些屬性會自動應用於 MetricsInstance 和 LogsInstance 的 Pod。
完整的自定義資源層級架構如下:
Grafana Agent Operator 使用自定義資源上的標籤匹配來構建層級結構。
下圖說明了匹配情況:Grafana Agent 取得與標籤 instance: primary 匹配的MetricsInstance 和 LogsInstance 實例,並且這些實例以相同的方式獲取資源。
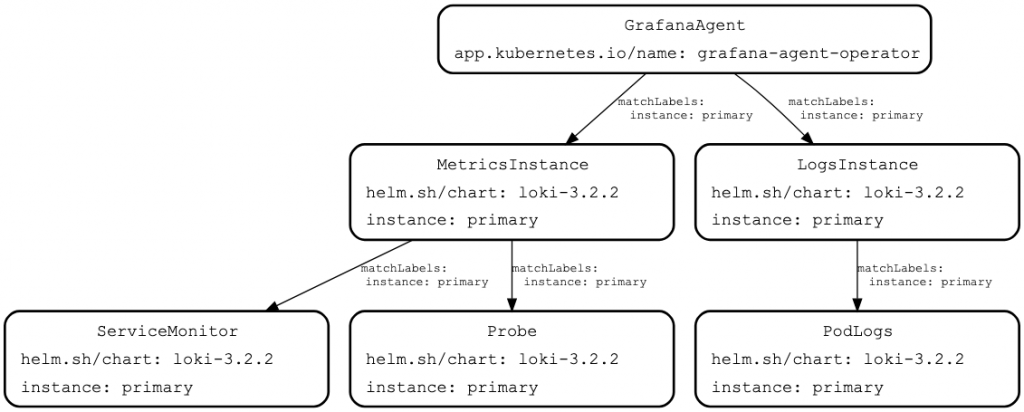
看在這裡我們可以清楚的理解,為何 Grafana Agent Operator 可以號稱兼容 Prometheus Operator 的 CRD 了,Grafana Agent 自動的利用 Kubernetes 服務發現以及 Prometheus Operator CRD 取得相關資源設定,在底層幫我們組出最終的 Grafana Agent 設定檔。
在接下來的實戰中,我們將利用先前建立好的 Kube-Prometheus-Stack 及其相關設定,來當作 Grafana Agent 的指標 remote_write 端點,其中詳細安裝過程可以回頭複習一下「Kube-Prometheus-Stack 實戰系列」。唯一不同的是我們將解開 Prometheus 的遠端寫入 remote_write 的封印。
# values.yaml
....
prometheus:
  enabled: true
  prometheusSpec:
    enableRemoteWriteReceiver: true
我們只要簡單的將原先的設定檔 enableRemoteWriteReceiver 參數調成 true 即可馬上執行 helm 更新。
helm upgrade --install prometheus-stack prometheus-community/kube-prometheus-stack --values=values.yaml -n prometheus --create-namespace
首先確認 Grafana Helm Repo 是否存在。
helm repo add grafana https://grafana.github.io/helm-charts
helm repo update
接下來就可以直接安裝 grafana/grafana-agent-operator。
helm upgrade --install grafana-agent-operator grafana/grafana-agent-operator -n monitoring --create-namespace
接下來,我們規劃個使用情境,來讓我們更清楚 Grafana Agent Operator CRD 是怎麼互相協作的。我們將建立一個附帶 Postgres Exporter 的 Postgres Pod 來當作指標的來源,之後開始建構 Grafana Agent 及其最終設定,首先建立一個 Grafana Agent CRD 並且定義其 RBAC 權限及 ServiceAccount,之後建立 PodMonitor CRD 來綁定 postgres pod 及其指標端口,最後此 PodMonitor CRD 將會被 MetricsInstance CRD 發現並且開始在 Grafana Agent 的 Statefulset Pod 抓取 Postgres Exporter 指標。
以上的敘述中,我們總共會建立以下資源:
# grafana-agent.yaml
apiVersion: monitoring.grafana.com/v1alpha1
kind: GrafanaAgent
metadata:
  name: grafana-agent
  namespace: monitoring
  labels:
    app: grafana-agent
spec:
  image: grafana/agent:v0.36.1
  integrations:
    selector:
      matchLabels:
        agent: grafana-agent-integrations
  logLevel: info
  serviceAccountName: grafana-agent
  disableReporting: true
  metrics:
    instanceSelector:
      matchLabels:
        agent: grafana-agent-metrics
  logs:
    instanceSelector:
      matchLabels:
        agent: grafana-agent-logs
---
apiVersion: v1
kind: ServiceAccount
metadata:
  name: grafana-agent
  namespace: monitoring

---
apiVersion: rbac.authorization.k8s.io/v1
kind: ClusterRole
metadata:
  name: grafana-agent
rules:
  - apiGroups:
      - ""
    resources:
      - nodes
      - nodes/proxy
      - nodes/metrics
      - services
      - endpoints
      - pods
      - events
    verbs:
      - get
      - list
      - watch
  - apiGroups:
      - networking.k8s.io
    resources:
      - ingresses
    verbs:
      - get
      - list
      - watch
  - nonResourceURLs:
      - /metrics
      - /metrics/cadvisor
    verbs:
      - get
---

apiVersion: rbac.authorization.k8s.io/v1
kind: ClusterRoleBinding
metadata:
  name: grafana-agent
roleRef:
  apiGroup: rbac.authorization.k8s.io
  kind: ClusterRole
  name: grafana-agent
subjects:
  - kind: ServiceAccount
    name: grafana-agent
    namespace: monitoring
我們在這裡需要給予 Grafana Agent 對應的 RBAC 權限來產生對應的 Instance,並且使用 LabelSelector 來辨識 MetricsInstance、LogsInstance、Integration 資源。
注意:Grafana Agent 貼心的幫我們預設開啟傳送資料到 Grafana 官方,這邊可以將 disableReporting 改成 true 來停止傳輸。
# postgres-with-exporter.yaml
apiVersion: apps/v1
kind: Deployment
metadata:
  name: postgres-with-exporter
spec:
  replicas: 1
  selector:
    matchLabels:
      app: postgres-with-exporter
  template:
    metadata:
      labels:
        app: postgres-with-exporter
    spec:
      containers:
        - name: postgres
          image: postgres:latest
          env:
            - name: POSTGRES_PASSWORD
              value: yourpassword
          ports:
            - containerPort: 5432

        - name: postgres-exporter
          image: wrouesnel/postgres_exporter:latest
          ports:
            - containerPort: 9187
              name: metrics
          env:
            - name: DATA_SOURCE_NAME
              value: postgres://postgres:yourpassword@localhost:5432/postgres?sslmode=disable
在這裡我們簡單的建立了一個內建 Postgres Exporter 的 Postgres 服務。
# postgres-podmonitor.yaml
apiVersion: monitoring.coreos.com/v1
kind: PodMonitor
metadata:
  name: postgres-exporter-podmonitor
  labels:
    name: postgres-exporter-podmonitor
spec:
  selector:
    matchLabels:
      app: postgres-with-exporter
  podMetricsEndpoints:
    - port: metrics
      interval: 30s
接著建立 PodMonitor 進行 Kubernetes 服務發現。
# metrics-instance.yaml
apiVersion: monitoring.grafana.com/v1alpha1
kind: MetricsInstance
metadata:
  name: primary
  namespace: monitoring
  labels:
    agent: grafana-agent-metrics
spec:
  remoteWrite:
    - url: http://prometheus-stack-prometheus.prometheus:9090/api/v1/write

  serviceMonitorNamespaceSelector: {}
  serviceMonitorSelector:
    matchLabels:
      name: postgres-exporter-podmonitor

  podMonitorNamespaceSelector: {}
  podMonitorSelector:
    matchLabels:
      name: postgres-exporter-podmonitor

  probeNamespaceSelector: {}
  probeSelector:
    matchLabels:
      name: postgres-exporter-podmonitor
最後我們將會建立 MetricsInstance CRD 資源,其將會發現符合 LabelSelector 的 Prometheus Operator CRD,最後 Grafana Agent 將會將指標寫入我們指定的 remoteWrite.url 端點的 Prometheus 中。
kubectl apply -f grafana-agent.yaml,postgres-with-exporter.yaml,postgres-podmonitor.yaml,metrics-instance.yaml
------
grafanaagent.monitoring.grafana.com/grafana-agent created
serviceaccount/grafana-agent created
clusterrole.rbac.authorization.k8s.io/grafana-agent created
clusterrolebinding.rbac.authorization.k8s.io/grafana-agent created
deployment.apps/postgres-with-exporter created
podmonitor.monitoring.coreos.com/postgres-exporter-podmonitor created
metricsinstance.monitoring.grafana.com/primary created
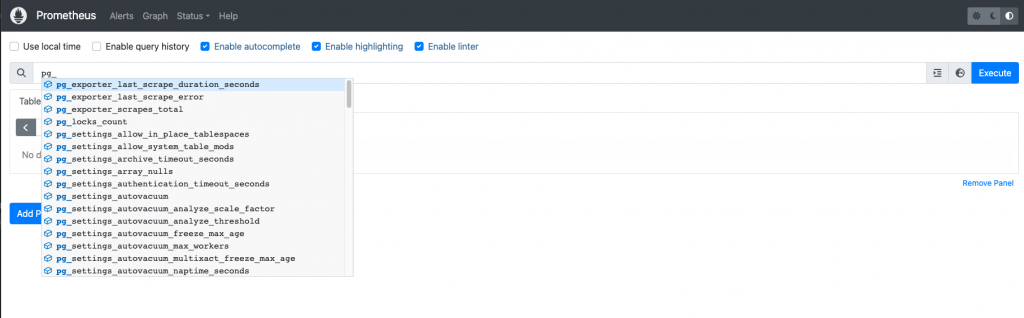
沒有意外的話,我們很快就可以在 Prometheus Web UI 中,查詢到 pg_ 開頭來自 Postgres Exporter 的指標。
kubectl port-forward service/prometheus-stack-prometheus 9090:9090 -n prometheus
------
Forwarding from 127.0.0.1:9090 -> 9090
Forwarding from [::1]:9090 -> 9090
在今天的章節裡,我們深入體驗了「Grafana Agent Static mode Kubernetes Operator」所展現的前衛設計。此設計反映了 Grafana 社群與 Prometheus 社群之間緊密且不可分割的連結。這絕對是兩大社群合作的雙贏案例。Grafana 把 Grafana Agent 的源碼回饋給 Prometheus,從而孕育出了 Prometheus Agent。再進一步,Grafana Agent 利用了成熟的 Prometheus Operator CRD 生態系統,進而創造出了與 Prometheus 完全兼容的 Grafana Agent Operator。這一策略大幅減少了龐大的 Prometheus 使用者的遷移困難,因為在 Kubernetes 的世界裡,Prometheus 幾乎等同於監控的代名詞,這正是 Grafana 團隊一直堅持聆聽社群意願的證明之一。
相關程式碼同步收錄在:
https://github.com/MikeHsu0618/grafana-stack-in-kubernetes/tree/main/day20
References
Add custom scrape jobs | Grafana Agent documentation
integrations_config | Grafana Agent documentation
