昨天透過 ELK 實現了集中式的日誌架構,今天要來介紹可觀測性的第二支柱 Metrics。
Metrics 是指某種能用來衡量或監控應用程序的數據資料,包括系統或服務的運行狀態、性能、資源利用率..等等,這些數據讓我們能達到以下目標
故障排除: 可觀察性metrics的一個主要目標是幫助您快速識別並解決問題。當系統或應用程式出現故障時,度量可以提供關於何處出現問題的信息,並幫助定位根本原因。
性能優化: 通過監控性能metrics,您可以識別性能瓶頸,找到需要優化的區域,並改進應用程式或系統的效能。這有助於提供更快的響應時間,降低延遲,提高用戶體驗。
資源規劃: 了解資源的使用情況有助於規劃未來的資源需求。如果您知道資源的使用趨勢,您可以合理地擴展或縮減資源,以確保系統能夠應對變化的工作負載。
自動化: 透過metrics,您可以實現自動化,例如自動擴展或自動回收資源,以根據需求調整系統的規模和配置
我們來介紹 Prometheus 與 Grafana 這個主流的 Metrics 解決方案。

圖檔來自 - Prometheus 官方
Prometheus 是一個高度可擴展的開源監控工具,用於收集、存儲和查詢時間序列數據,例如性能指標和事件數據。
主動收集 metrics: Prometheus 主要透過 pull 主動向應用程序收集 metrics,例如 Web、API Server 這種長時間運行的服務都適合使用 pull 模式。被動收集 metrics: 若是 Job 或 Batch 類型的應用程序,因執行時間可能較短,在 prometheus 主動收集 metrics 之前可能應用程序就關閉了,這時候應用程序能將 metrics 主動推送到 push-gateway,提供給 Prometheus。資料存儲: Prometheus 內建 TSDB,用來儲存收集到的 metricsAPI server:提供 API 讓 Prometheus UI 或 Grafana 調用服務發現: 與 Kubernetes 高度相容,能自動找到 Pod 收集 Metrics告警通知: 支援告警功能,可以在特定條件下觸發警報,例如閾值超過。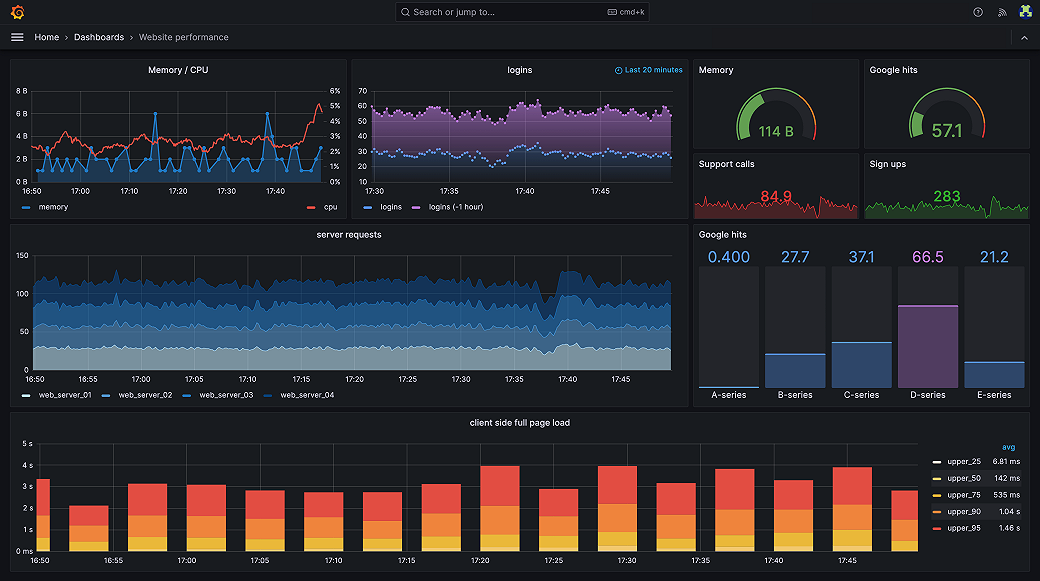
Grafana 是一個開源的數據視覺化和監控平台,它可以將收集的數據轉化為圖表、圖形、儀表板和警報。
Dashboard 設計: Grafana允許用戶輕鬆設計自定義儀表板,並將多個圖表和面板組合在一起以進行全面的監控。多數據源支持: Grafana支持多種數據源,包括Prometheus、InfluxDB、Elasticsearch、MySQL等,這使得它可以與各種數據來源集成,提供一個統一的視覺化界面。告警通知: 支援告警功能,可以在特定條件下觸發告警,例如閾值超過或其他數據趨勢。權限控制: Grafana允許管理多個用戶和組織,並根據用戶角色分配不同的權限。
圖檔來自 - Prometheus 官方
我們使用 Prometheus 官方經典的架構,利用 Prometheus 的服務發現機制,自動找到 Pod 來收取 ,metrics,並將數據持久化。
透過 Grafana 建立 Dashborad 將數據圖形化,方便檢視與理解數據或趨勢。
透過 helm 安裝 prometheus
kubectl create namespace prometheus

helm repo add prometheus-community https://prometheus-community.github.io/helm-charts

helm upgrade -i prometheus prometheus-community/prometheus \
    --namespace prometheus \
    --set alertmanager.persistentVolume.storageClass="gp2",server.persistentVolume.storageClass="gp2"
檢查 prometheus 服務是否正常運作
$ kubectl get pods -n prometheus

NAME                                                READY   STATUS    RESTARTS   AGE
prometheus-alertmanager-0                           1/1     Running   0          2m51s
prometheus-kube-state-metrics-d9955668-z26pw        1/1     Running   0          2m52s
prometheus-prometheus-node-exporter-bhhg9           1/1     Running   0          2m52s
prometheus-prometheus-node-exporter-q2gzw           1/1     Running   0          2m52s
prometheus-prometheus-pushgateway-cf8d5957c-gcssq   1/1     Running   0          2m52s
prometheus-server-7f6df57848-r2sg4                  2/2     Running   0          2m51s
到這裡我們就安裝好 Prometheus 了,現在將 Prometheus Web UI 服務轉發到本地 9009 port
kubectl --namespace=prometheus port-forward deploy/prometheus-server 9090
開啟瀏覽器,連線至 http://localhost:9090/,能看到 Prometheus Web UI。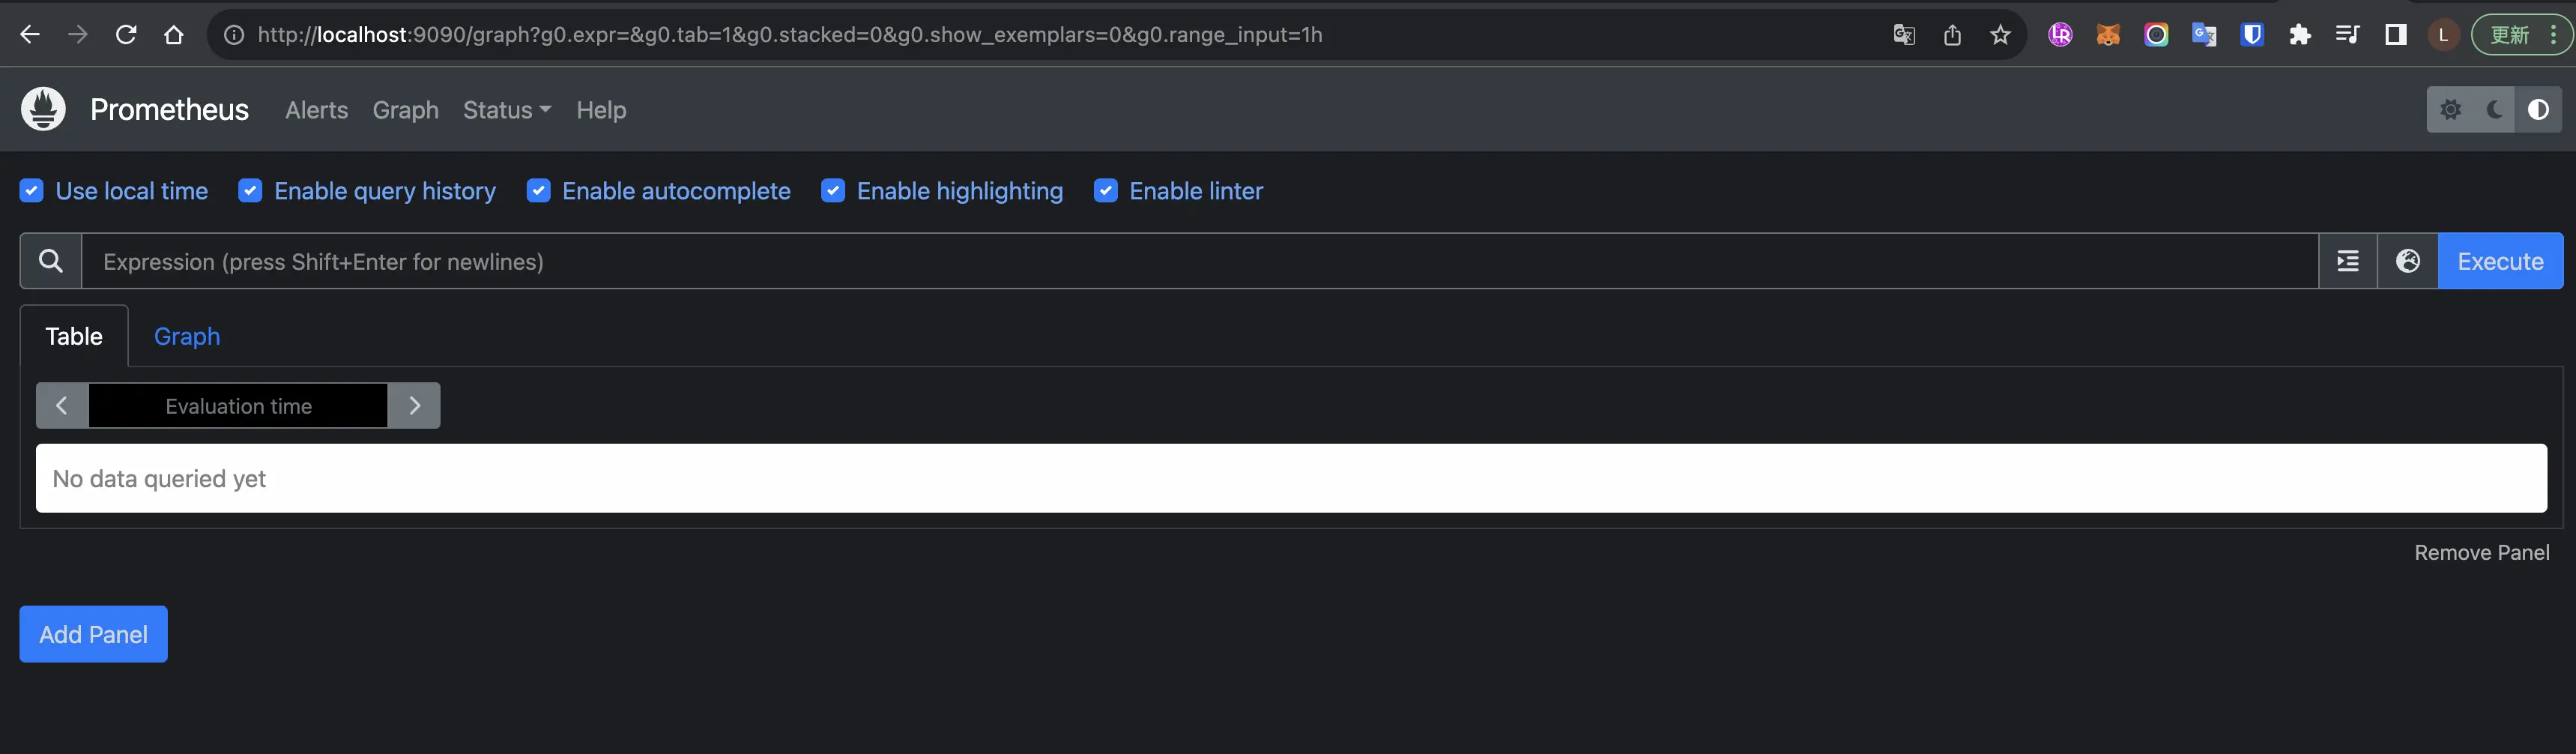
能透過 Prometheus Web UI 使用 PromQL 查詢 metrics,但這時候我們應該查不到什麼資料,還需要設定安裝 Metrics server 才能收集到 Kubernetes 的 Metrics。
Metrics server 是一個用於收集和提供 Kubernetes 集群內容器和 Pods 性能指標的工具,我們安珠
kubectl apply -f https://github.com/kubernetes-sigs/metrics-server/releases/latest/download/components.yaml
檢視 metrics server 是否正常運作
$ kubectl get deployment metrics-server -n kube-system

NAME             READY   UP-TO-DATE   AVAILABLE   AGE
metrics-server   1/1     1            1           33h
回到 Prometheus Web UI,查詢欄位填寫 container_memory_usage_bytes,測試一下,查看 container 的 記憶體使用量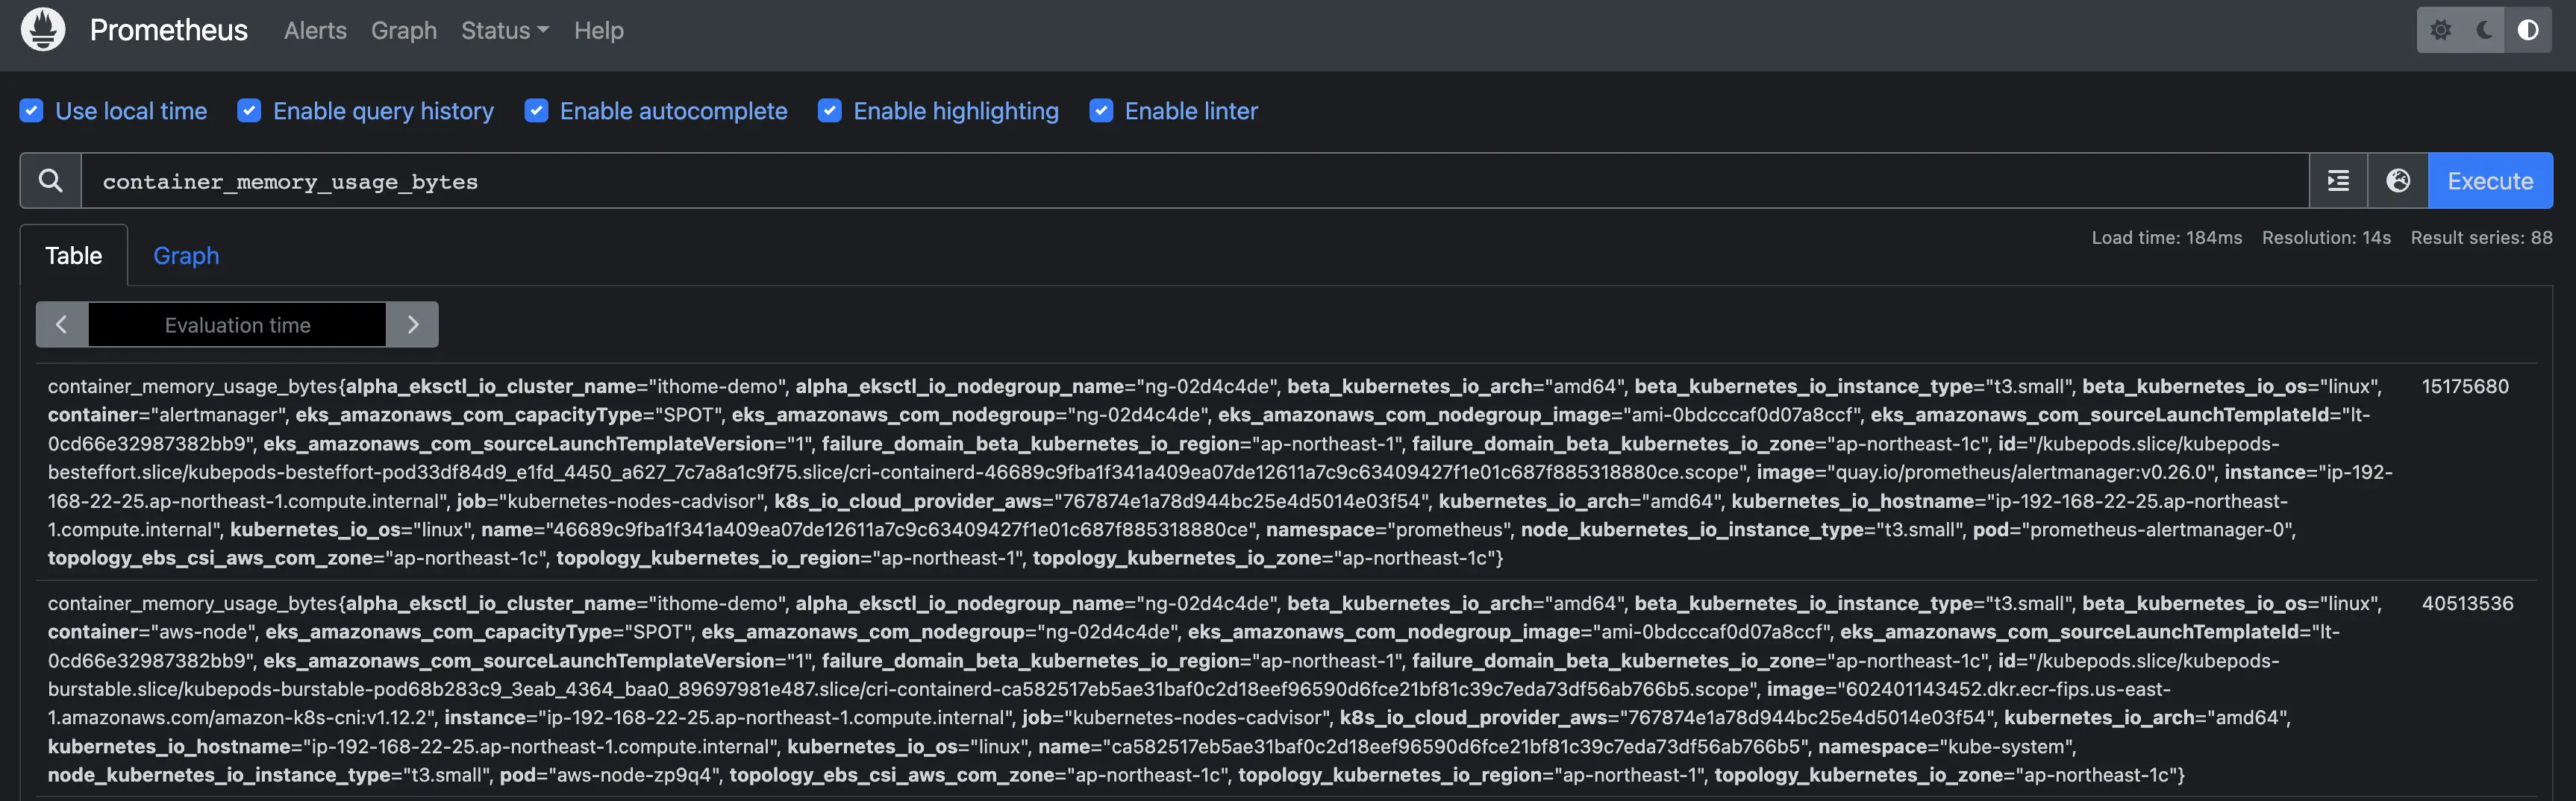
能查到應代表 metrics-server 正常運作,且 Prometheus 也正常收集 metrics 了。
這些數據目前都還不容易檢視跟理解,只要先確定有資料,後續我們在透過 Grafana 圖形化。
目前 Metrics server 已經提供了 Node, Container 層級的 metrics。但通常我們需要應用程序更細節的 metrics 資訊,如 JVM Heap、Non-Heap、GC 頻率。所以接下來已 Java 的應用程序為例,提供這些 metrics 給 Prometheus。
Prometheus Exporter 是一種用於將應用程式或系統的度量數據轉換為 Prometheus 格式的工具。
我們在 Spring boot 框架有提供實現 Prometheus Exporter 的組件,我們使用該組件來曝露一個 http 端點,由端點提供 prometheus 格式的 metrics。
添加依賴項到 spring boot 的應用程序中
於 pom.xml 中添加以下依賴
<dependency>
    <groupId>org.springframework.boot</groupId>
    <artifactId>spring-boot-starter-actuator</artifactId>
</dependency>

<dependency>
    <groupId>io.micrometer</groupId>
    <artifactId>micrometer-registry-prometheus</artifactId>
    <scope>runtime</scope>
</dependency>
啟用並曝露 prometheus metrics http 端點,於 application.yml 新增以下內容
management:
endpoints:
    web:
    exposure:
        include: prometheus
測試該端點,運行服務後,呼叫 http://localhost:8080/actuator/prometheus
$ curl http://localhost:8080/actuator/prometheus

# HELP executor_pool_core_threads The core number of threads for the pool
# TYPE executor_pool_core_threads gauge
executor_pool_core_threads{name="applicationTaskExecutor",} 8.0
# HELP process_cpu_usage The "recent cpu usage" for the Java Virtual Machine process
# TYPE process_cpu_usage gauge
process_cpu_usage 3.137719914303888E-4
# HELP jvm_gc_live_data_size_bytes Size of long-lived heap memory pool after reclamation
# TYPE jvm_gc_live_data_size_bytes gauge
jvm_gc_live_data_size_bytes 0.0
... 以下省略
到這裡我們已經讓應用程序有能力提供更詳細的 metrics了,但要如何讓 prometheus 知道要從這個 http 端點收集 metrics 呢?
讓我們快速得看一下 Promethues 的服務發現機制
Promethues 會從 Kubernetes API server 自動查到 Node/Service/Pod 等資源的資訊,讓我們看看如何讓 Prometheus 收集 Pod 的 Metrics。
開啟 Prometheus Web UI / Status / Configration,其中 scrape_configs 屬性中定義了 Prometheus 如何定期收集 metrics,我們能看到有一組設定為 job_name: kubernetes-pods
job_name: kubernetes-pods 部分內容如下
- job_name: kubernetes-pods
  honor_labels: true
  honor_timestamps: true
  scrape_interval: 1m # metrics 收集頻率
  scrape_timeout: 10s
  metrics_path: /metrics # 預設抓取 metrics 的 URL path
  scheme: http
  follow_redirects: true
  enable_http2: true
  relabel_configs:
  - source_labels: [__meta_kubernetes_pod_annotation_prometheus_io_scrape] # 當 Pod 的 annotation 包含 prometheus.io/scrape: "true" 時,收取該 Pod metrics
    separator: ;
    regex: "true"
    replacement: $1
    action: keep
  - source_labels: [__meta_kubernetes_pod_annotation_prometheus_io_path] # 當 Pod 的 annotation 包含 prometheus.io/path key 時,使用該 value 當 URL path 收集 metrics
    separator: ;
    regex: (.+)
    target_label: __metrics_path__
    replacement: $1
    action: replace
  - source_labels: [__meta_kubernetes_pod_annotation_prometheus_io_port, __meta_kubernetes_pod_ip] # 當 Pod 的 annotation 包含 prometheus.io/port 時,使用該 value 當收集 metrics 端點的 port number
    separator: ;
    regex: (\d+);((([0-9]+?)(\.|$)){4})
    target_label: __address__
    replacement: $2:$1
    action: replace
能看到預設的收取 metrics 的位址為 /metrics 且使用 http,而 spring boot 預設的端點位址為 http://localhost:8080/actuator/prometheus,所以我們透過 Pod annotation 告訴 Prometheus 正確的收取端點,我們在 development 中的 spec.template.annotations 添加幾個 annotation
告訴 Prometheus 要收集此 Pod 的 metrics
從
/actuator/prometheus這個 URL path 收集
收集時使用 8080 port
例如
apiVersion: apps/v1
kind: Deployment
metadata:
  creationTimestamp: null
  labels:
    app: app-backend
  name: app-backend
  namespace: ithome
spec:
  replicas: 1
  selector:
    matchLabels:
      app: app-backend
  strategy: {}
  template:
    metadata:
      creationTimestamp: null
      labels:
        app: app-backend
      annotations:
        prometheus.io/scrape: "true"
        prometheus.io/port: "8080"
        prometheus.io/path: "/actuator/prometheus"
    spec:
...省略
並部署該 devlopment 到 Kubernetes 中。
再回到 Prometheus Web UI,查詢 jvm_memory_used_bytes,就能看到 JVM 記憶體使用量的 metrics。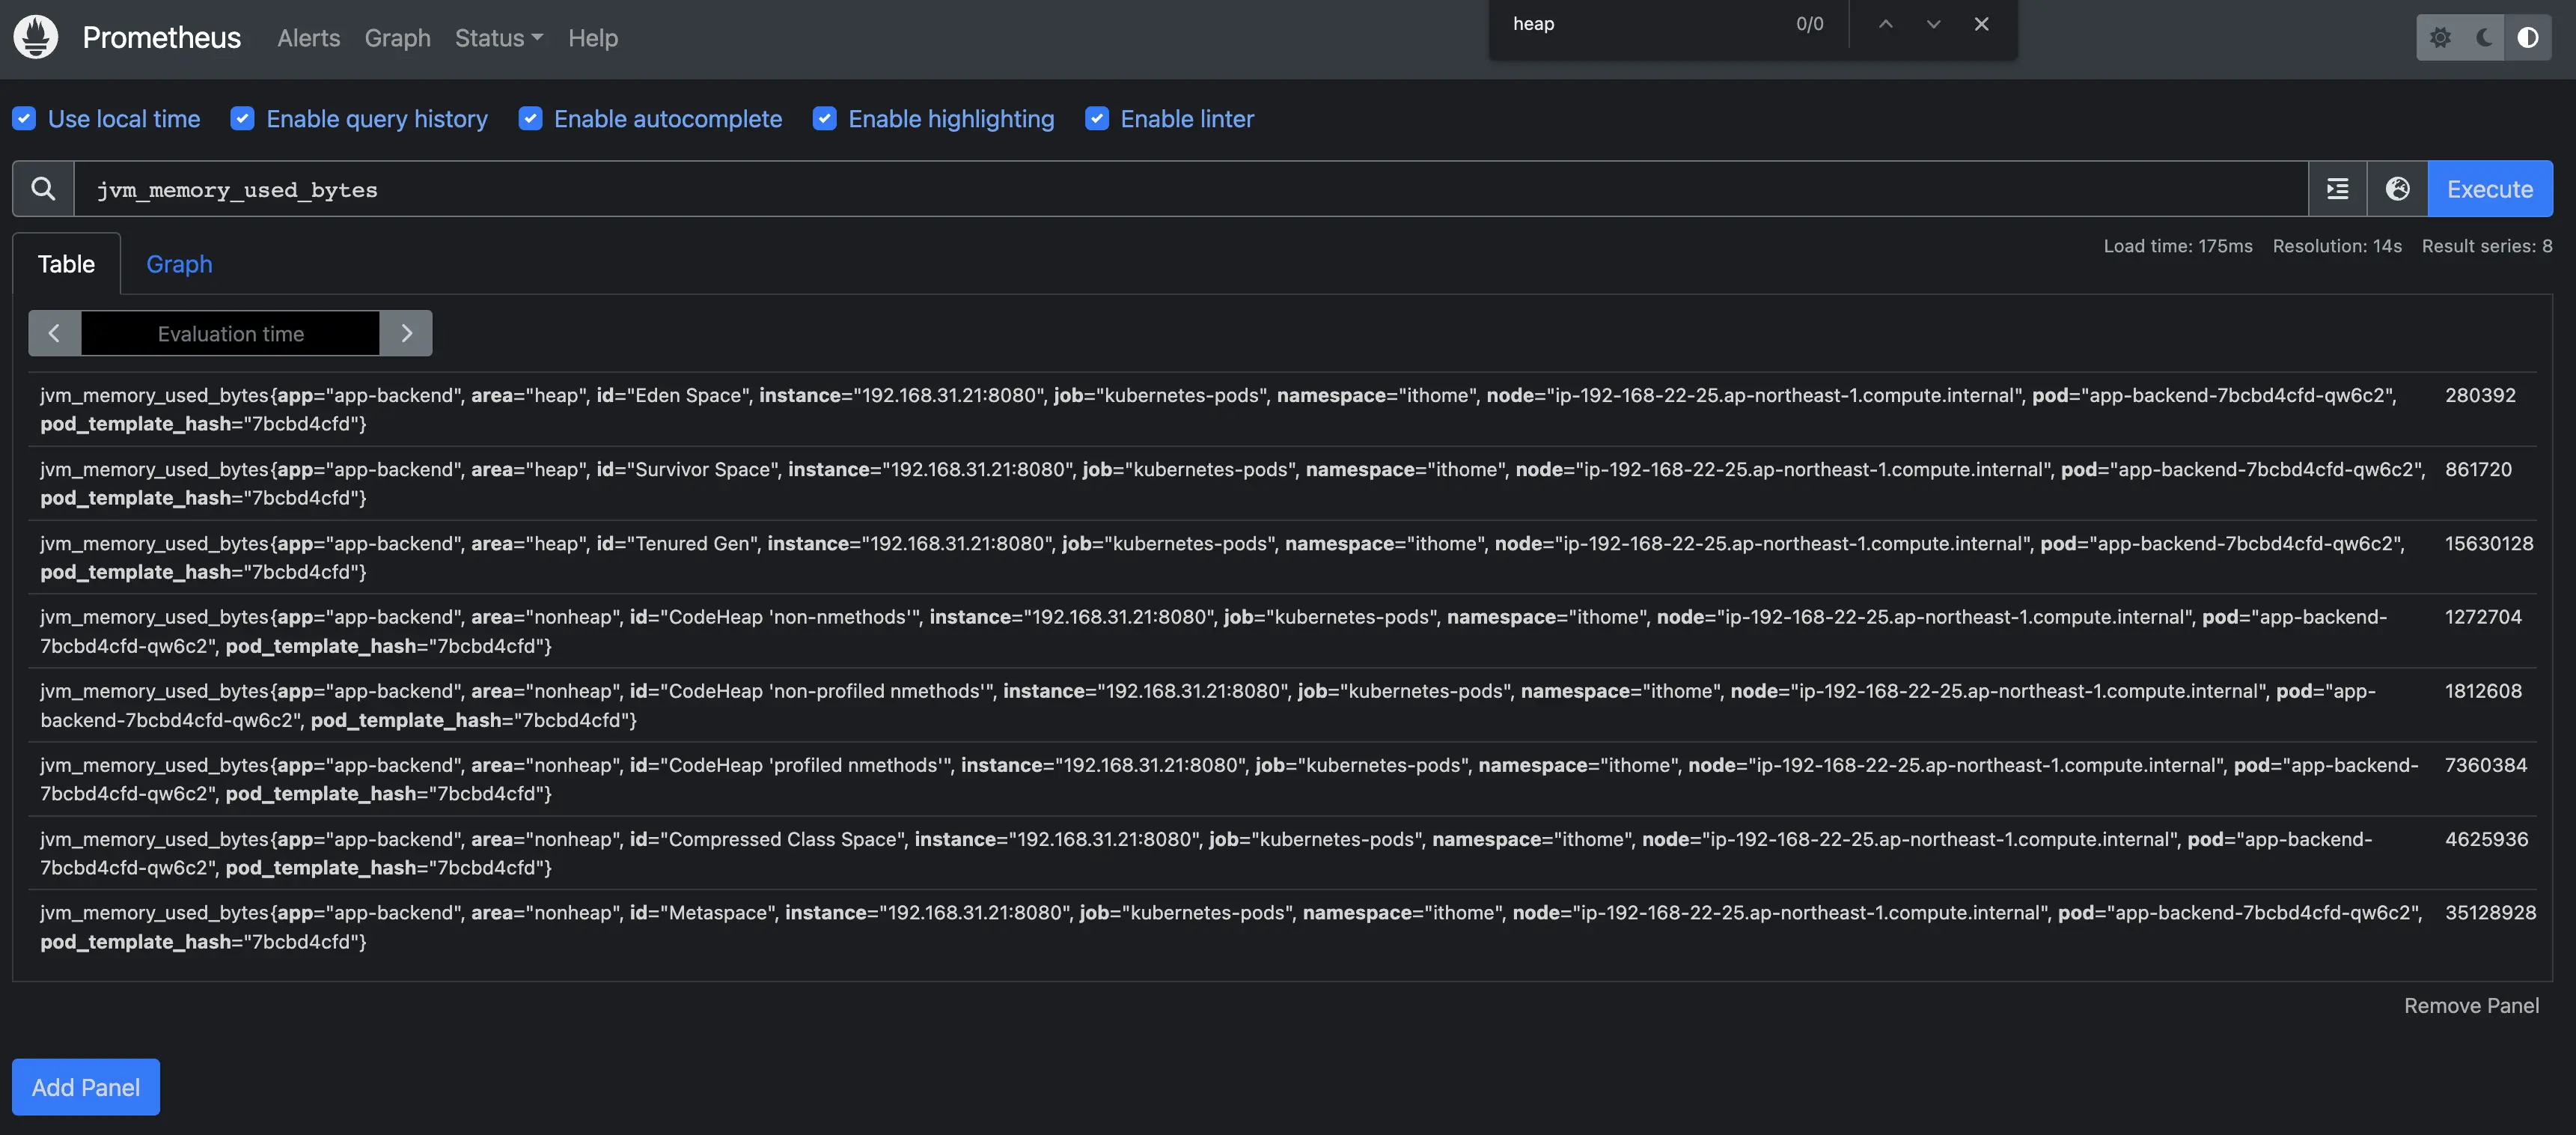
到這裡,我們透過 metrics-server 與 spring boot 中的 prometheus exporter 提供了 metrics 數據,並依賴 Prometheus 的服務發現機制,透過 pull 模式定期收集 metrics 並持久化到 Prometheus 當中。
但這些 metrics 原始數據不容易閱讀與理解,接下來我們使用 grafana 將其圖形化。
我們透過 helm 來安裝 Grafana
新增 grafana helm repo
helm repo add grafana https://grafana.github.io/helm-charts
helm repo update
準備 helm chart 參數檔
cat << EoF >grafana-params.yaml
datasources:
  datasources.yaml:
    apiVersion: 1
    datasources:
    - name: Prometheus
      type: prometheus
      url: http://prometheus-server.prometheus.svc.cluster.local
      access: proxy
      isDefault: true
EoF
建立 Grafana
kubectl create namespace grafana

helm install grafana grafana/grafana \
    --namespace grafana \
    --set persistence.storageClassName="gp2" \
    --set persistence.enabled=true \
    --set adminPassword='itHomeDeM0' \
    --values ./grafana-params.yaml
移除 helm chart 參數檔
rm ./grafana-params.yaml
kubectl get secret --namespace grafana grafana -o jsonpath="{.data.admin-password}" | base64 --decode ; echo
helm install 時,有輸入自定義密碼,若忘記能用此指令取回
kubectl port-forward -n grafana services/grafana 3000:80
localhost:3000,並輸入帳密登入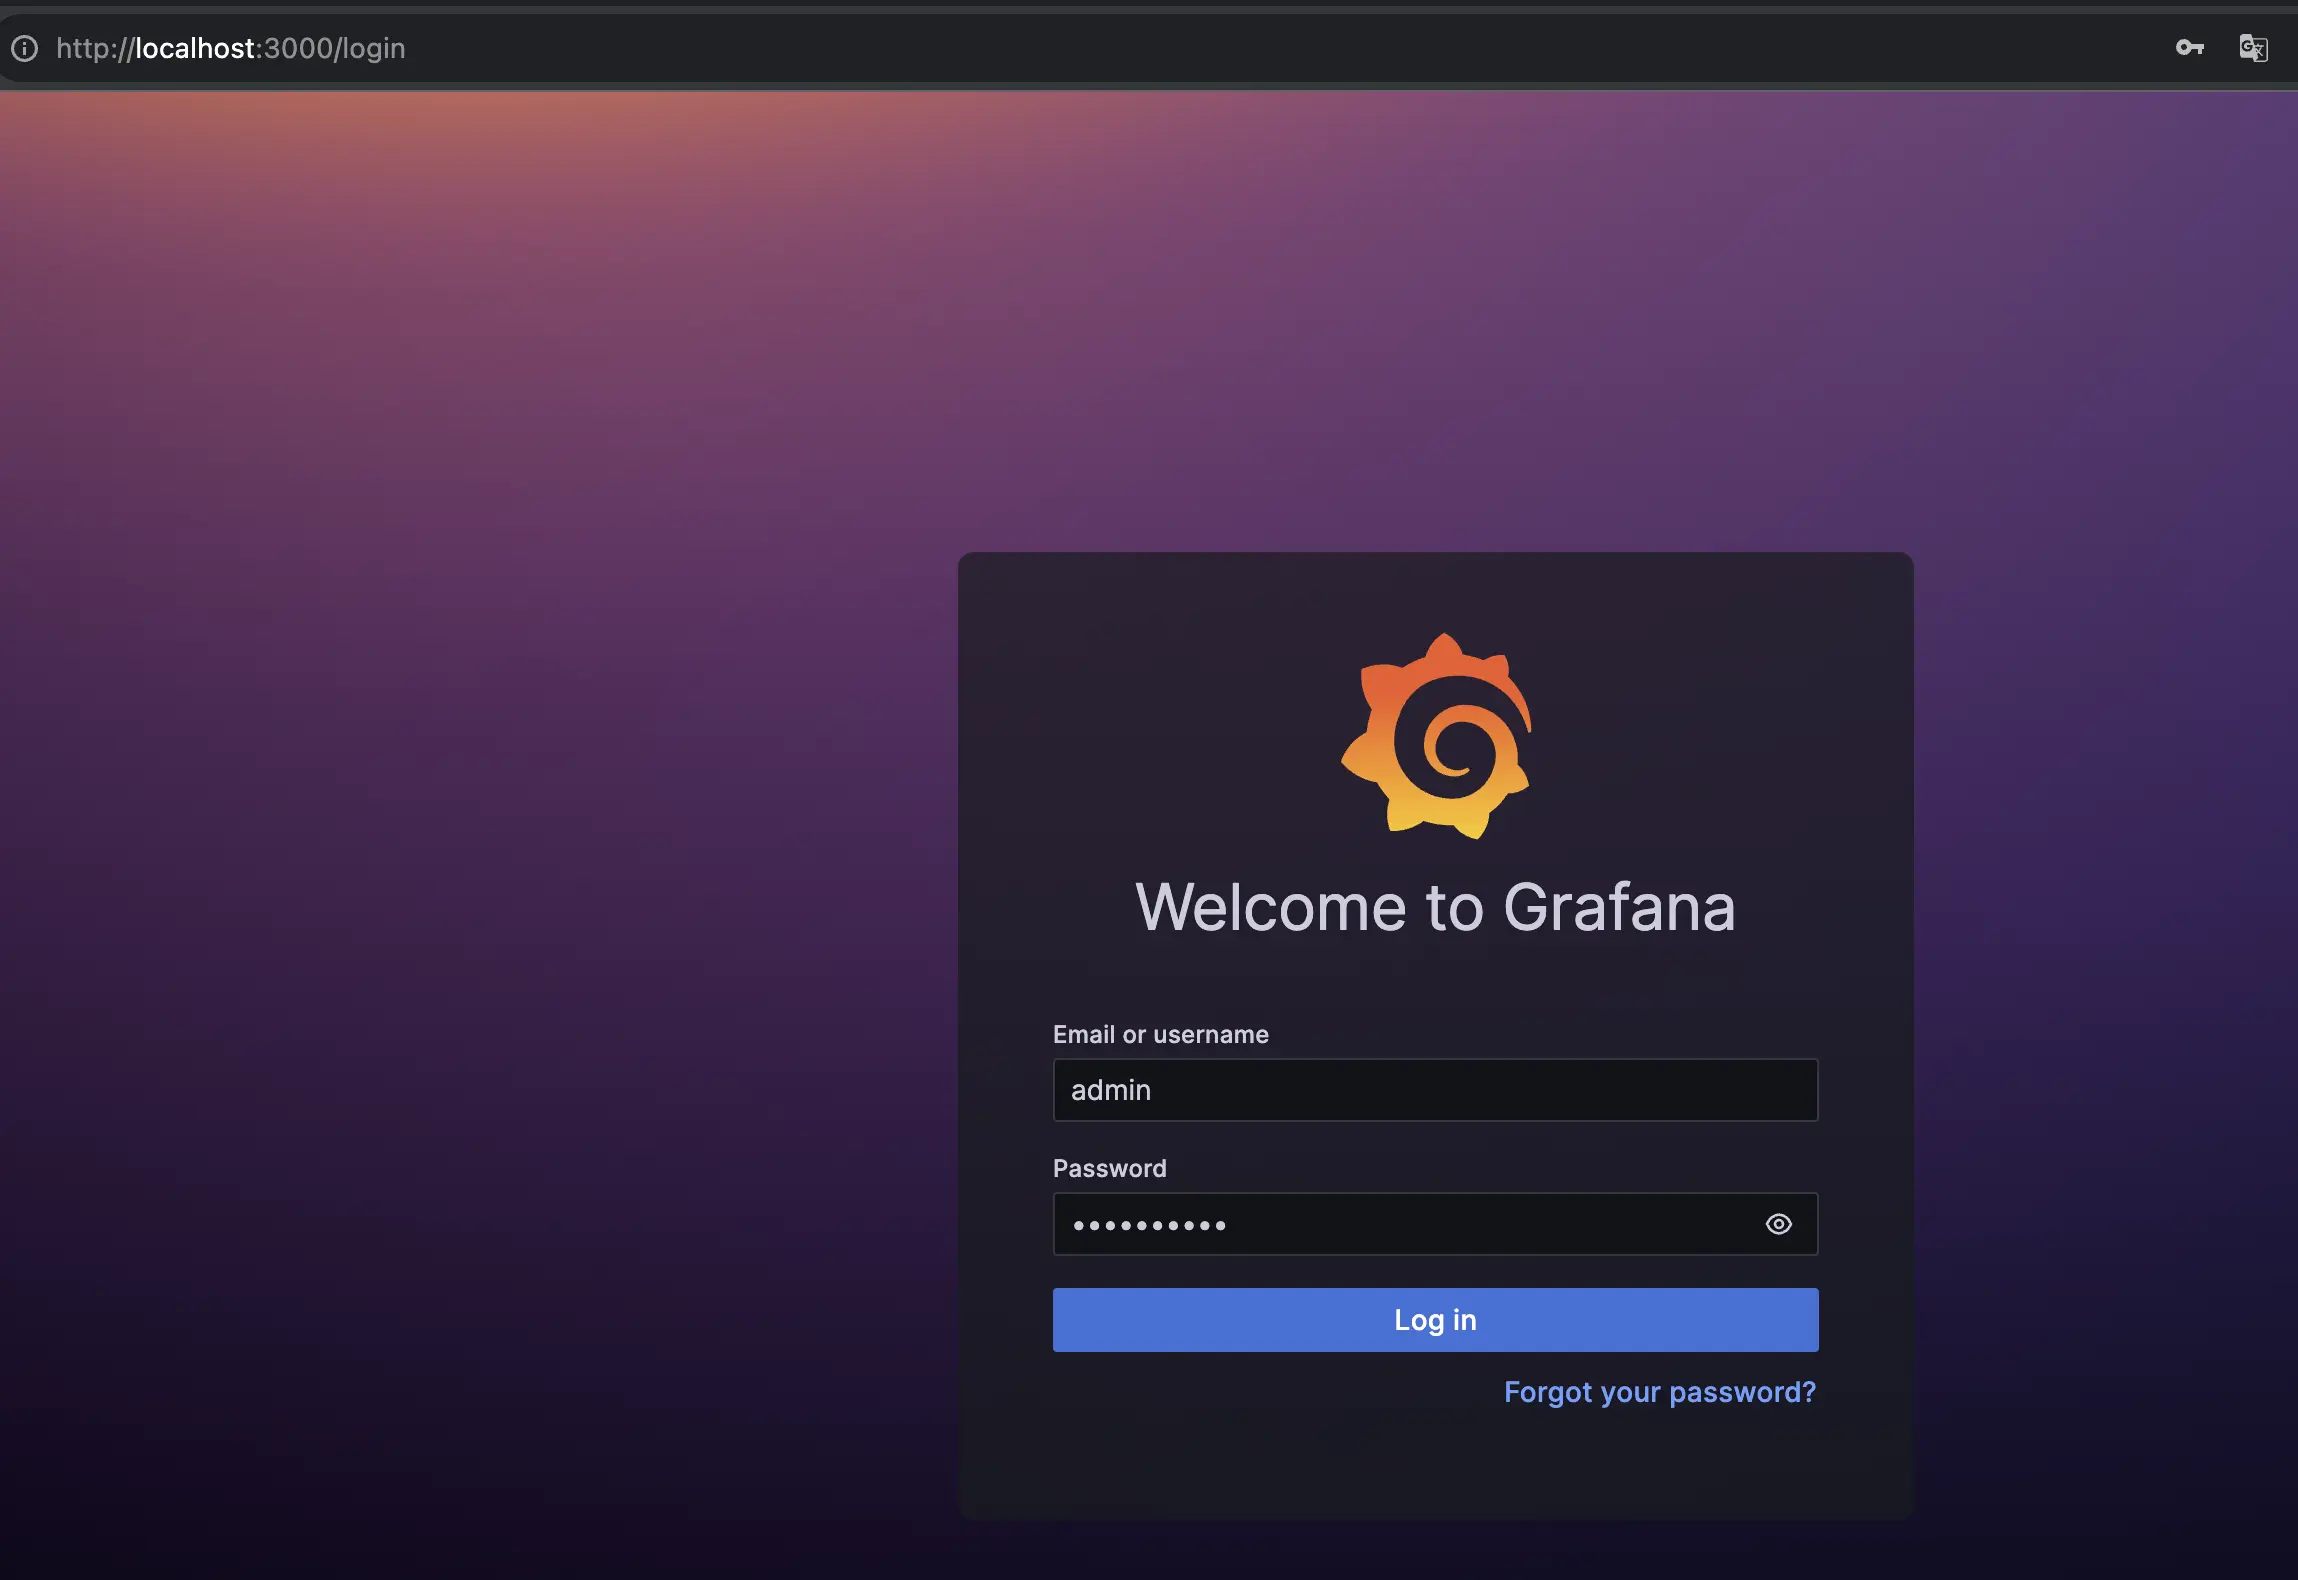
我們先匯入一個展示現成的 dashboard
開啟左側列表,點擊 Dashboards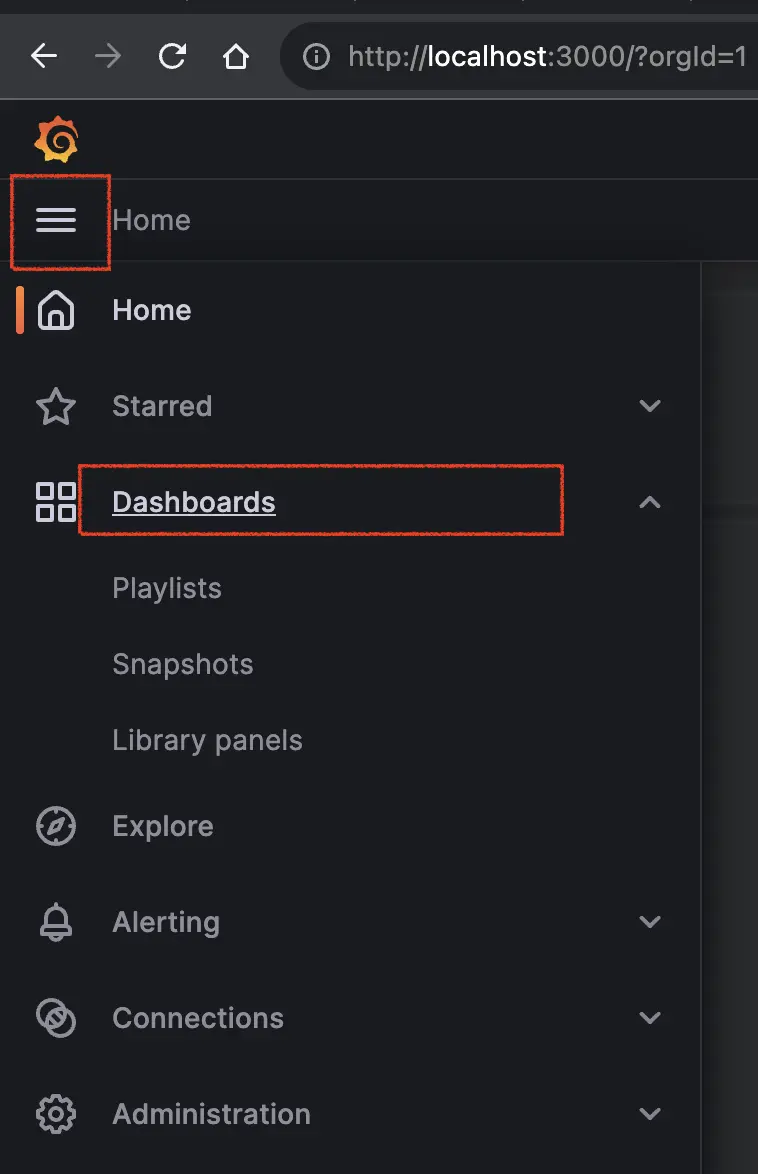
點選右側 "New" 按鈕,並選擇 "import"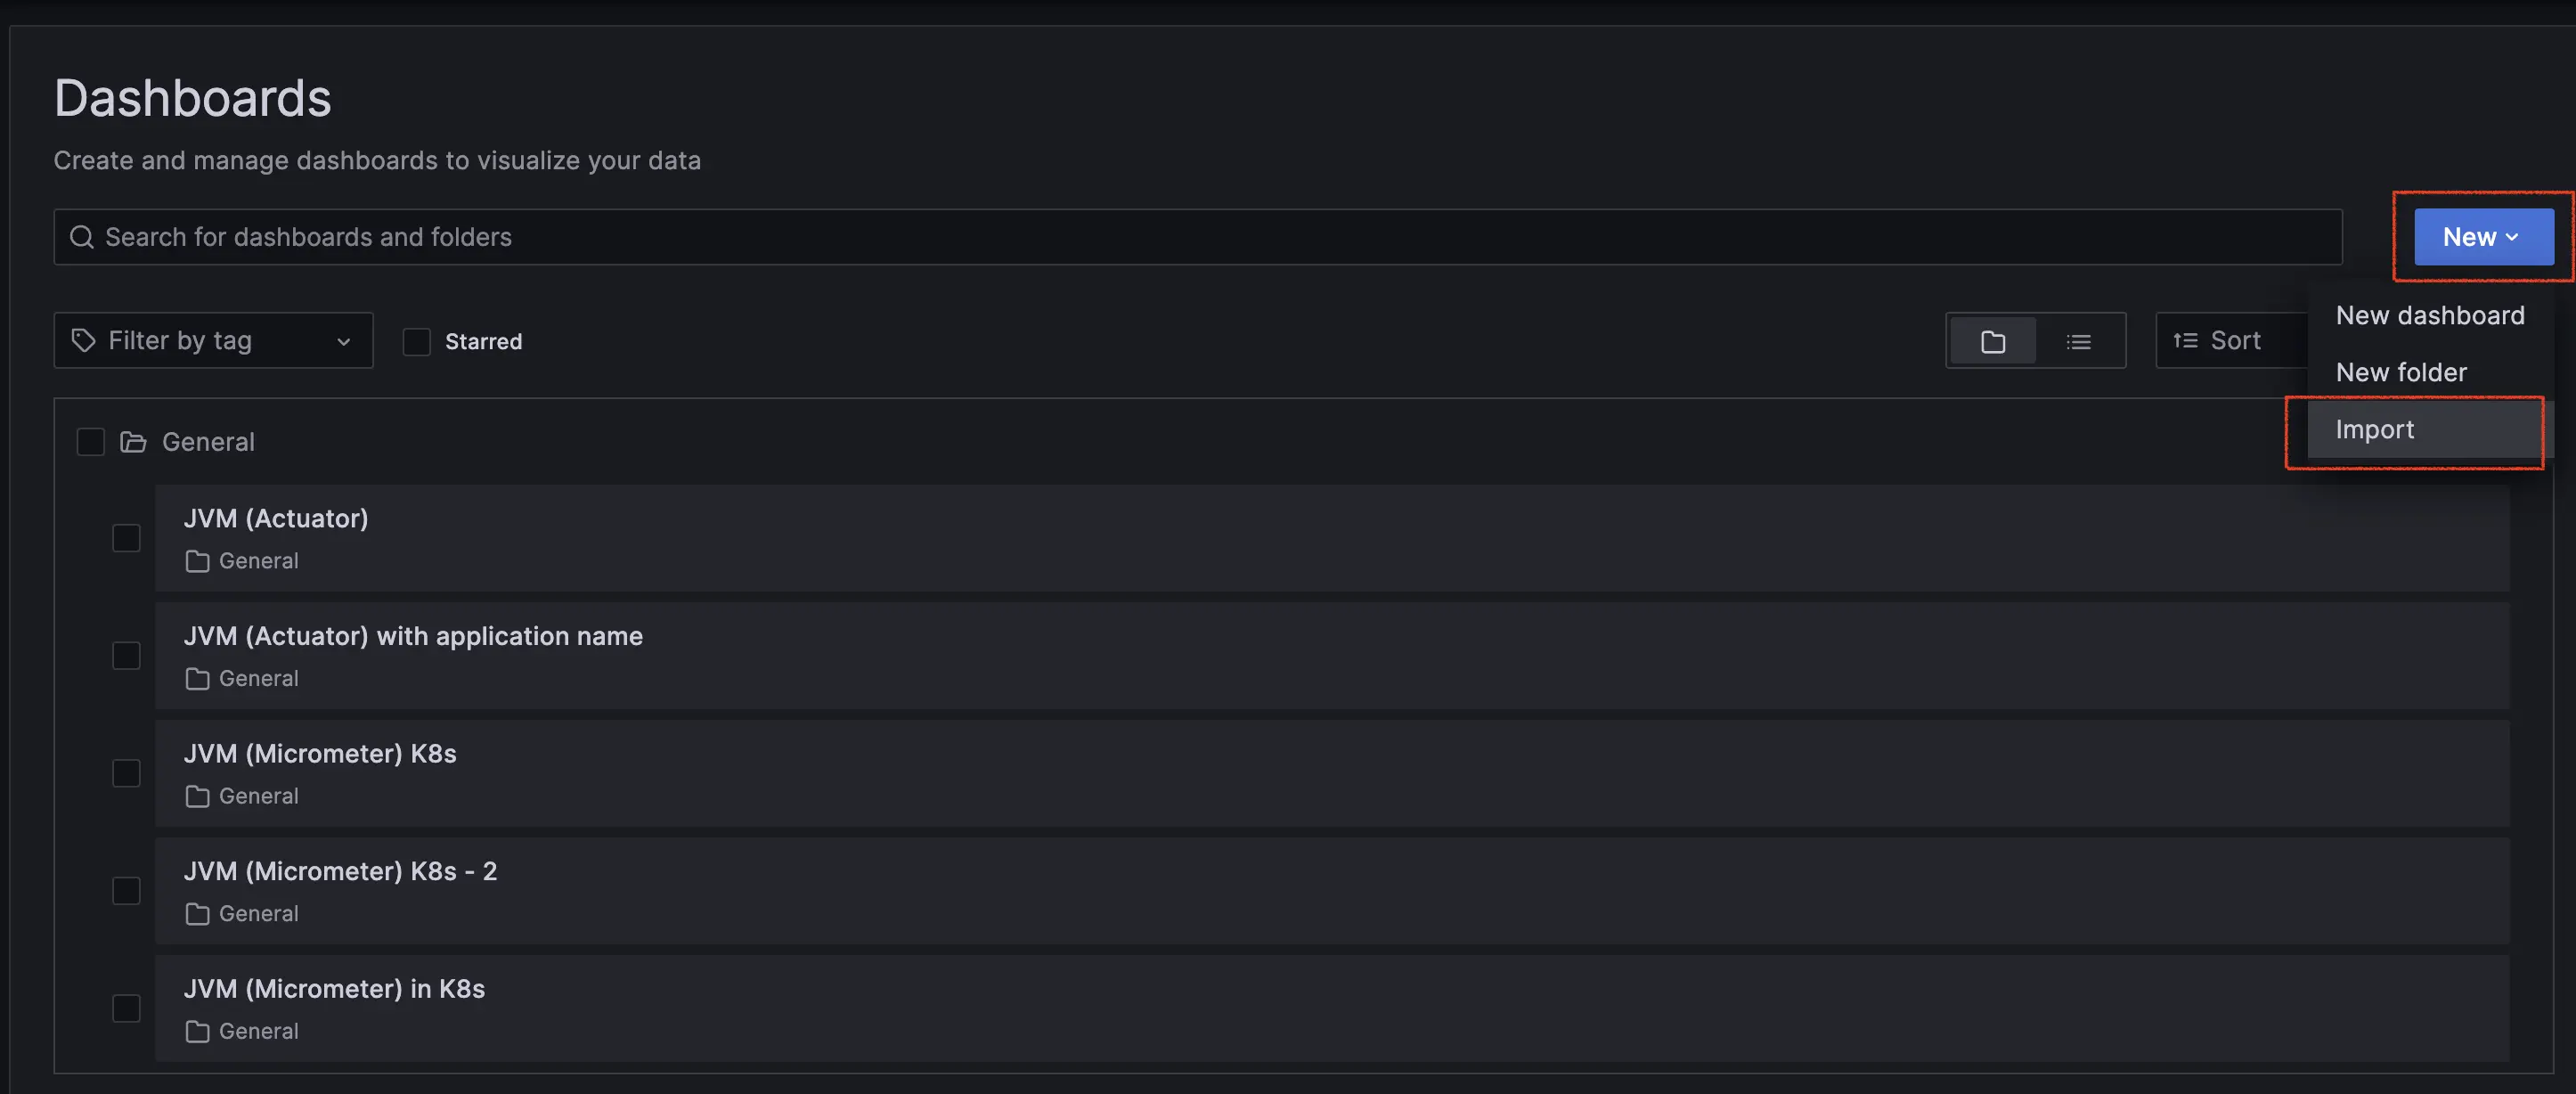
輸入 dashboard Id: 10939,並點選 Load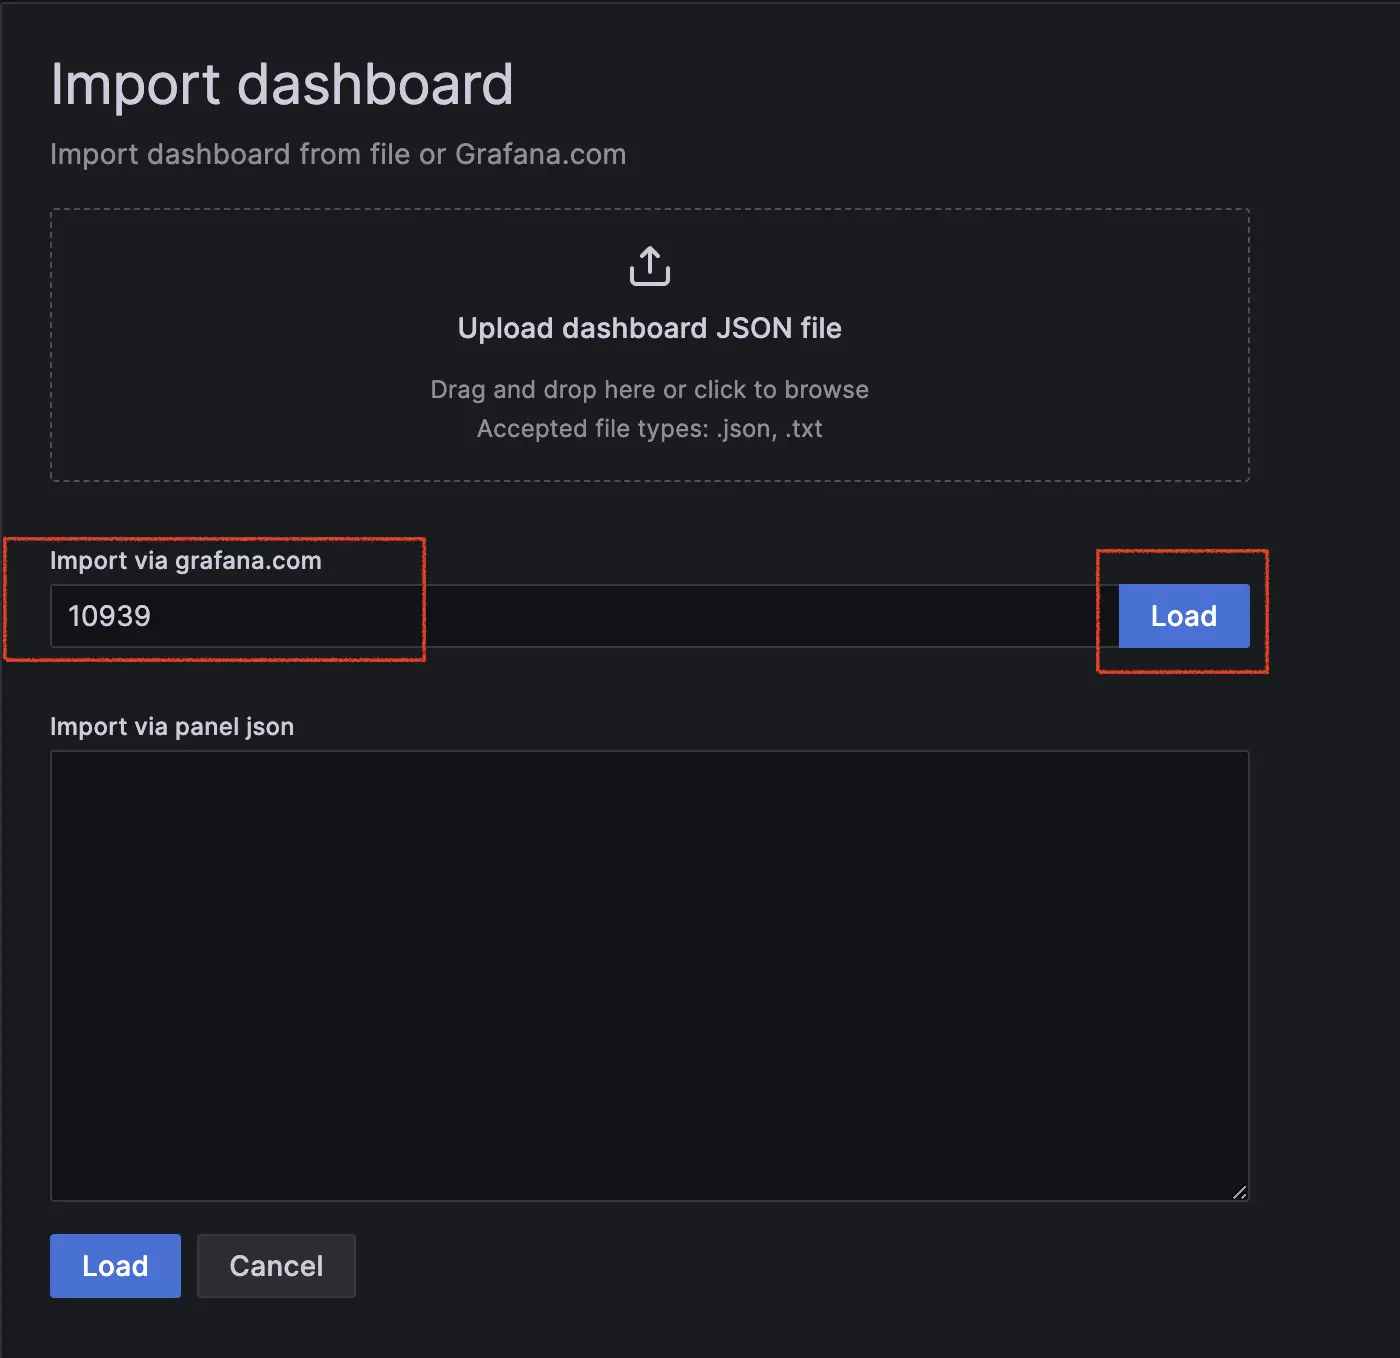
此範本來源連結
能上 Grafana 官方查詢更多 Dashboard 範本
選擇範本資料源後,點選 import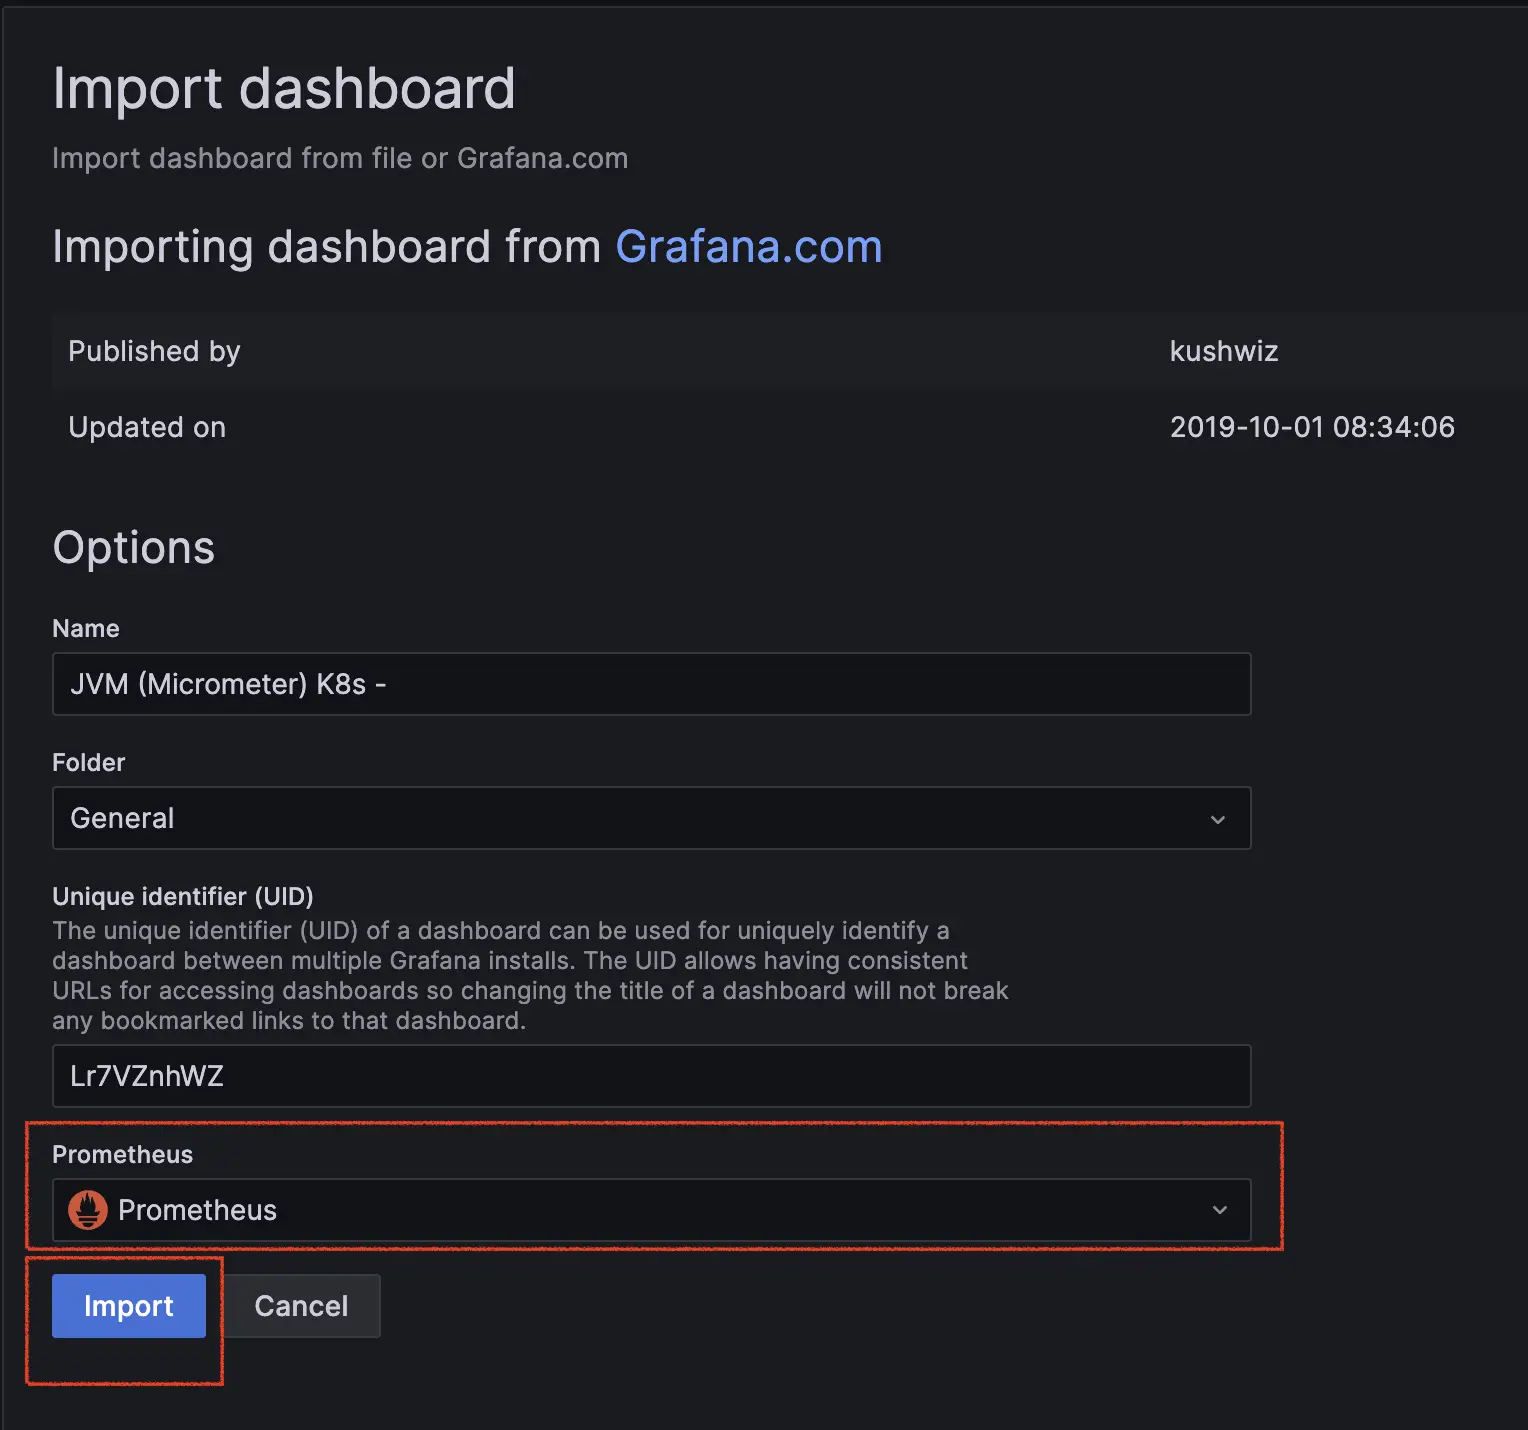
檢視 Dashboard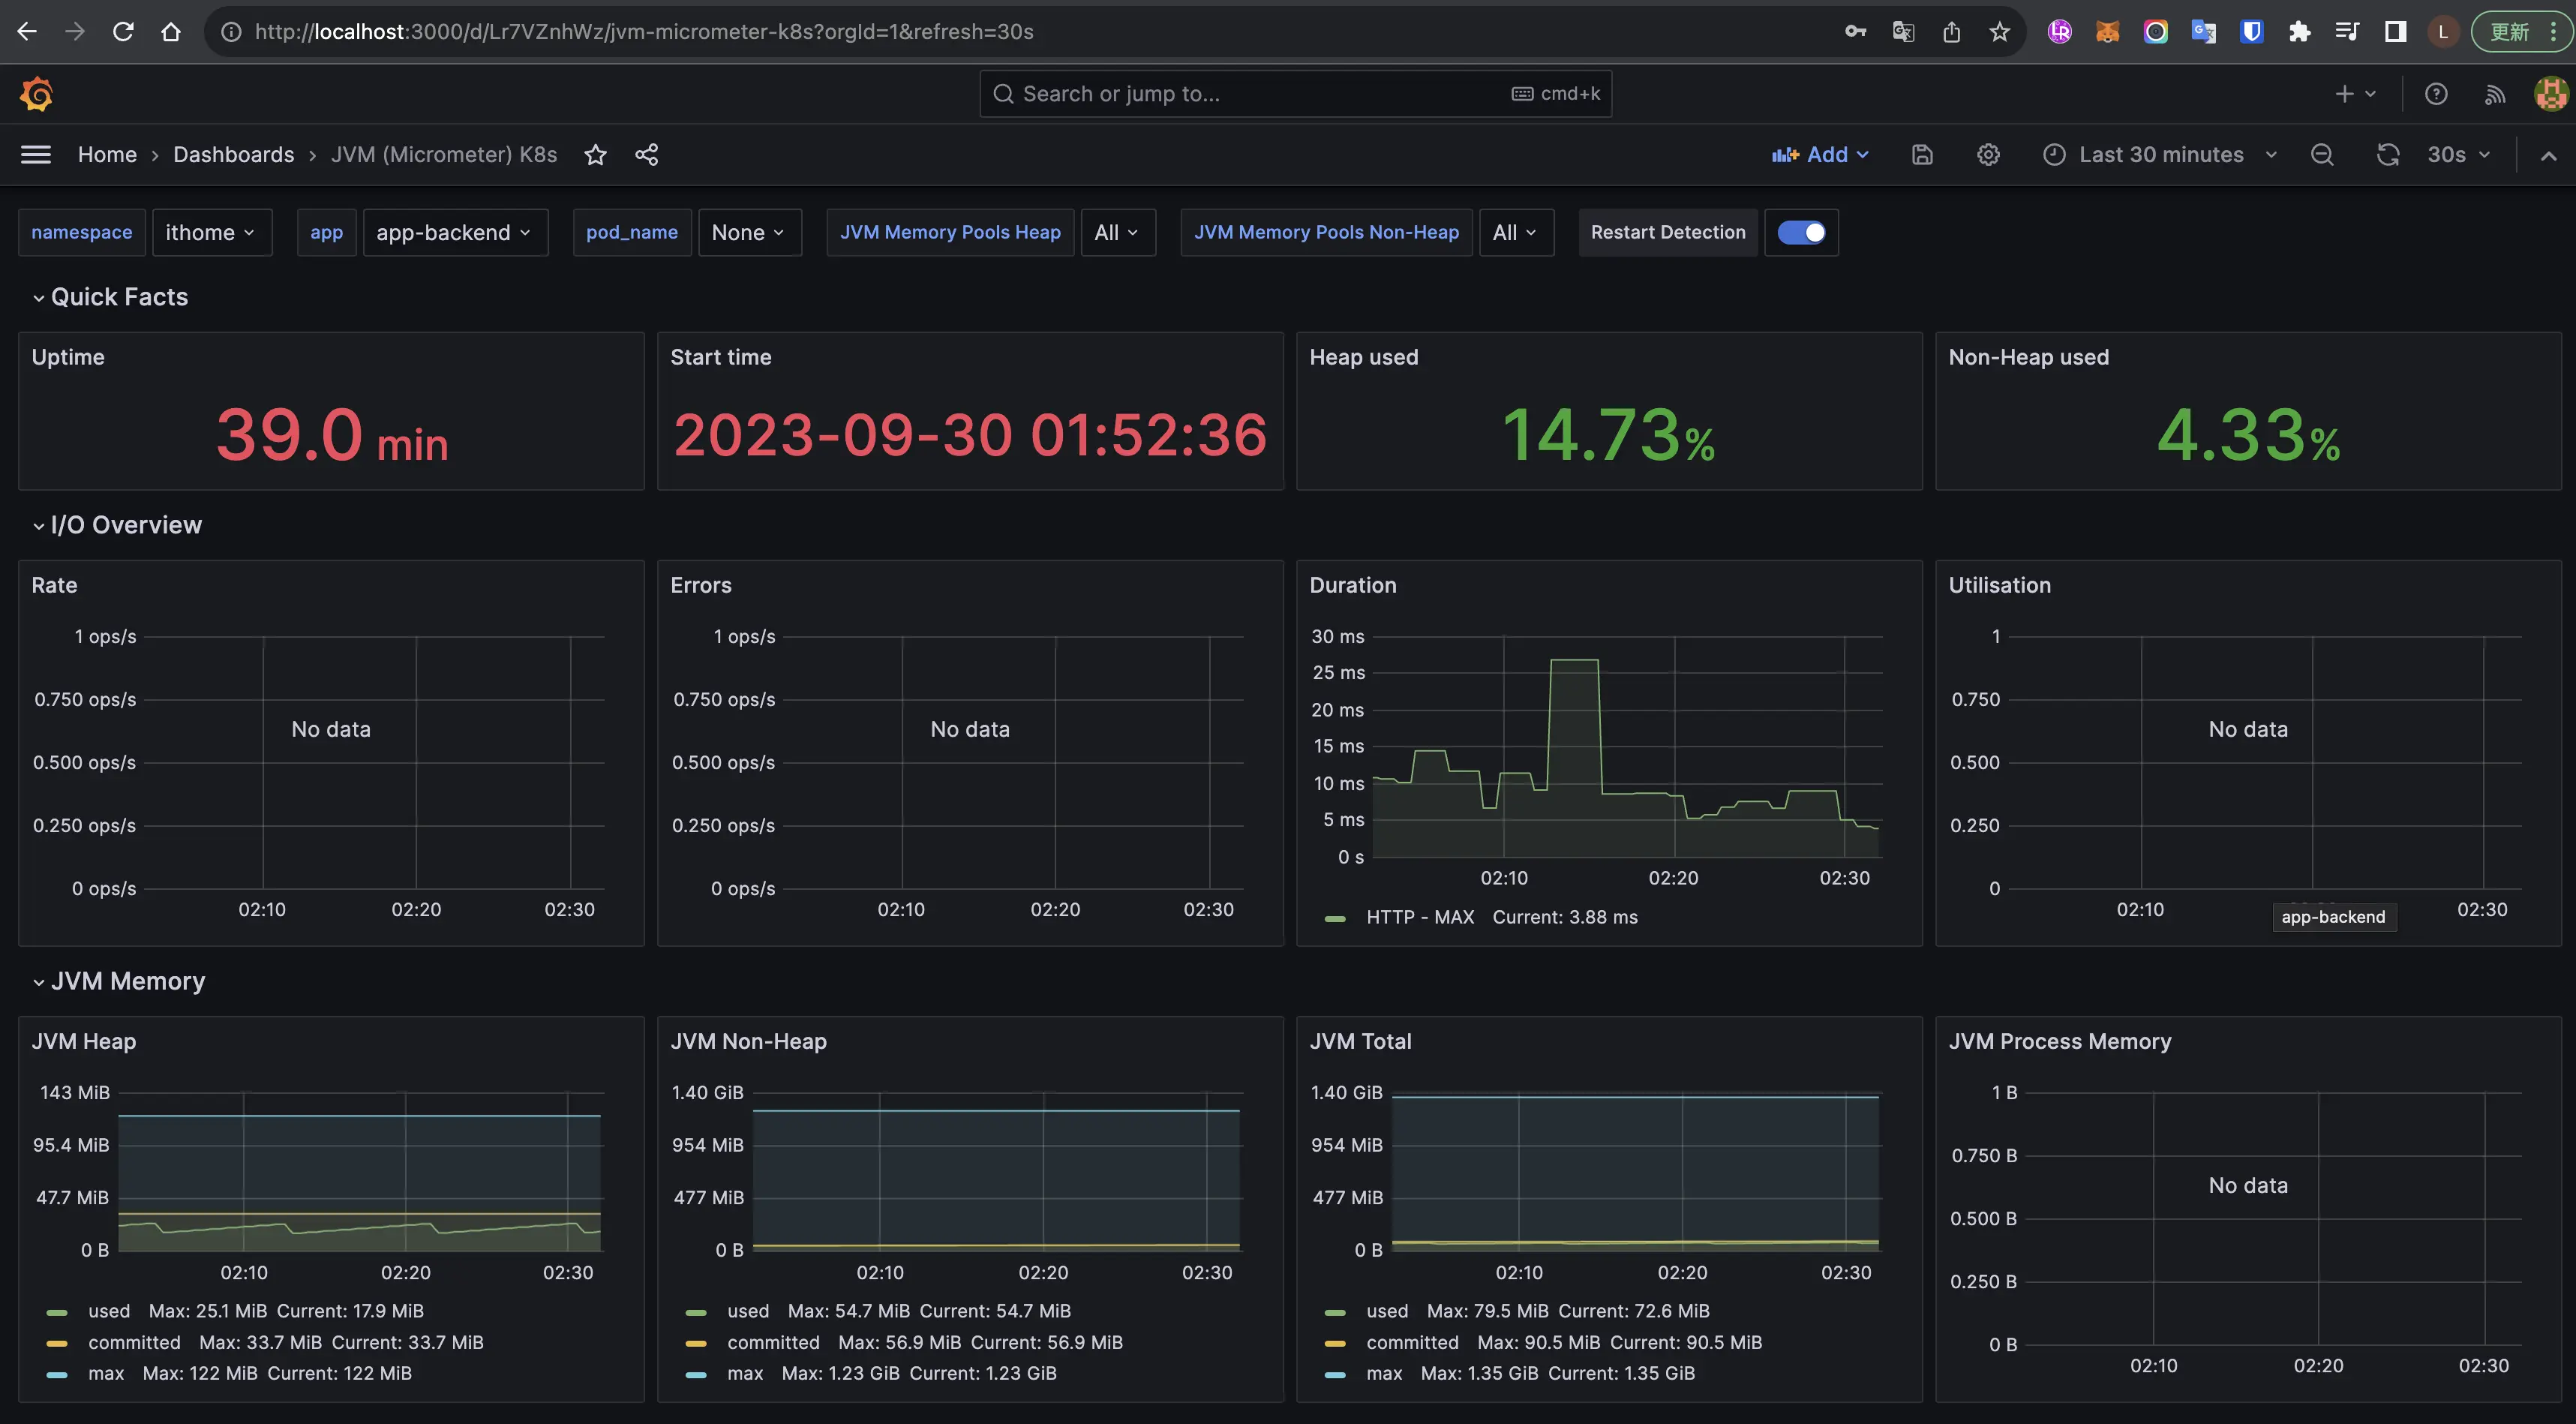
能看到 Dashboard 有許多詳細的 JVM metrics,且透過圖形化呈現,能更容易理解。
今天介紹了 Prometheus 與 Grafana,並也透過 Spring boot 內建的 prometheus exporter,提供 metrics 讓 Prometheus 收集,到最後使用 Grafna 將 metrics 圖形化,希望對讀者們理解為什麼需要收集 metrics 跟 metrics 是如何收集到的。


 iThome鐵人賽