https://openlayers.org/en/latest/examples/measure-style.html
控制測量工具Day08是透過overlay來標記,所以可以用css控制
本篇是透過feature style來控制顯示的樣式
只有新增控制label的checkbox開關
<!DOCTYPE html>
<html lang="en">

<head>
    <meta charset="UTF-8" />
    <meta name="viewport" content="width=device-width, initial-scale=1.0" />
    <title>Document</title>

    <script src="https://cdn.jsdelivr.net/npm/ol@v8.2.0/dist/ol.js"></script>
    <link rel="stylesheet" href="https://cdn.jsdelivr.net/npm/ol@v8.2.0/ol.css">

    <link rel="stylesheet" href="style.css">
</head>

<body>
    <div id="map"></div>
    // 開關
    <label for="segments" id="segments-label">
        <input type="checkbox" id="segments" checked />
        隱藏或開啟label
    </label>
    <script type="module" src="./main.js"></script>
</body>

</html>
html,
body {
    margin: 0;
    padding: 0;
}

#map {
    width: 100vw;
    height: 100vh;
}

#segments-label {
    position: absolute;
    top: 10px;
    right: 10px;
}
特別注意styleFunction中是如何控制點的顯示,通篇重點我認為應該是這個funciton的理解,其餘都只是針對樣式或顏色的配置
const style = new ol.style.Style({
    fill: new ol.style.Fill({
        color: 'rgba(255, 255, 255, 0.2)',
    }),
    stroke: new ol.style.Stroke({
        color: 'rgba(0, 0, 0, 0.5)',
        lineDash: [10, 10],
        width: 2,
    }),
    image: new ol.style.Circle({
        radius: 5,
        stroke: new ol.style.Stroke({
            color: 'rgba(0, 0, 0, 0.7)',
        }),
        fill: new ol.style.Fill({
            color: 'rgba(255, 255, 255, 0.2)',
        }),
    }),
});

const labelStyle = new ol.style.Style({
    text: new ol.style.Text({
        font: '25px Calibri,sans-serif',
        fill: new ol.style.Fill({
            color: 'rgba(255, 255, 255, 1)',
        }),
        backgroundFill: new ol.style.Fill({
            color: 'rgba(0, 0, 0, 0.7)',
        }),
        padding: [3, 3, 3, 3],
        textBaseline: 'bottom',
        offsetY: -15,
    }),
    image: new ol.style.RegularShape({
        radius: 8,
        points: 3,
        angle: Math.PI,
        displacement: [0, 10],
        fill: new ol.style.Fill({
            color: 'rgba(0, 0, 0, 0.7)',
        }),
    }),
});

const segmentStyle = new ol.style.Style({
    text: new ol.style.Text({
        font: '20px Calibri,sans-serif',
        fill: new ol.style.Fill({
            color: 'rgba(255, 255, 255, 1)',
        }),
        backgroundFill: new ol.style.Fill({
            color: 'rgba(0, 0, 0, 0.4)',
        }),
        padding: [2, 2, 2, 2],
        textBaseline: 'bottom',
        offsetY: -12,
    }),
    image: new ol.style.RegularShape({
        radius: 6,
        points: 3,
        angle: Math.PI,
        displacement: [0, 8],
        fill: new ol.style.Fill({
            color: 'rgba(0, 0, 0, 0.4)',
        }),
    }),
});

const segmentStyles = [segmentStyle];

const formatLength = function (line) {
    const length = ol.sphere.getLength(line);
    let output;
    if (length > 100) {
        output = Math.round((length / 1000) * 100) / 100 + ' km';
    } else {
        output = Math.round(length * 100) / 100 + ' m';
    }
    return output;
};

const source = new ol.source.Vector();

function styleFunction(feature, segments, drawType) {
    const styles = [];
    const geometry = feature.getGeometry();
    const type = geometry.getType();
    let point, label, line;
    if (!drawType || drawType === type || type === 'Point') {
        styles.push(style);
        if (type === 'LineString') {
            point = new ol.geom.Point(geometry.getLastCoordinate());
            label = formatLength(geometry);
            line = geometry;
        }
    }

    // 線段中間
    if (segments && line) {
        let count = 0;
        //不斷計算線段長度
        line.forEachSegment(function (a, b) {
            const segment = new ol.geom.LineString([a, b]);
            const label = formatLength(segment);
            if (segmentStyles.length - 1 < count) {
                segmentStyles.push(segmentStyle.clone());
            }
            const segmentPoint = new ol.geom.Point(segment.getCoordinateAt(0.5)); // 指定線段中間的位置標記
            segmentStyles[count].setGeometry(segmentPoint);
            segmentStyles[count].getText().setText(label);
            styles.push(segmentStyles[count]);
            count++;
        });
    }

    // 最後一點的位置標記
    if (label) {
        labelStyle.setGeometry(point);
        labelStyle.getText().setText(label);
        styles.push(labelStyle);
    }
    return styles;
}

const vector = new ol.layer.Vector({
    source: source,
    style: function (feature) {
        return styleFunction(feature, showSegments.checked);
    },
});

const map = new ol.Map({
    layers: [
        new ol.layer.Tile({
            source: new ol.source.OSM()
        }),
        vector
    ],
    target: 'map',
    view: new ol.View({
        projection: "EPSG:3857",
        center: ol.proj.fromLonLat([120.846642, 23.488793]),
        zoom: 7.5,
        maxZoom: 20,
        minZoom: 5,
        enableRotation: false,
    }),
    controls: []
});


let draw; // global so we can remove it later

function addInteraction() {
    const drawType = 'LineString';
    draw = new ol.interaction.Draw({
        source: source,
        type: drawType,
        style: function (feature) {
            return styleFunction(feature, showSegments.checked, drawType);
        },
    });
    draw.on('drawstart', function () {
        source.clear();
    });
    map.addInteraction(draw);
}

addInteraction();

const showSegments = document.getElementById('segments');
showSegments.onchange = function () {
    vector.changed();
    draw.getOverlay().changed();
};
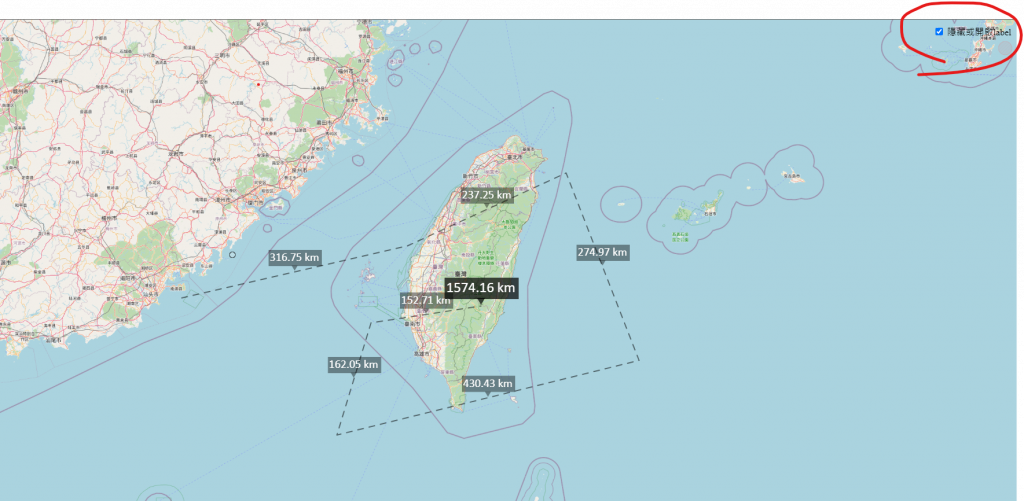
如果成功右上可以看到控制開關,自己玩玩看吧,成果如下圖
依據這兩天的操作,我們可以學到兩種控制的方式
我個人更喜歡第二種透過style function控制,因這樣可以讓我們的樣式更自由。
https://github.com/weijung0923/learning-openlayers-micromastery/tree/day09
