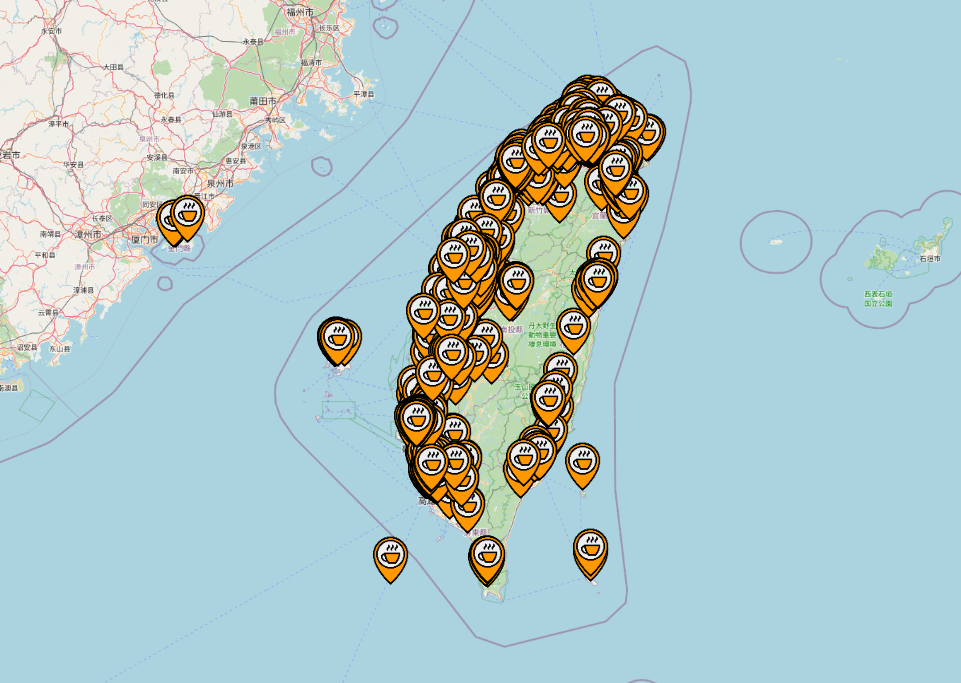
如果上一篇有了解的話,此篇只是單純加上取得額外json後再進行地圖點標註,未來可以依照需求更換想要的展示圖案。
上一篇是用新增的方式慢慢加入style和layer,本篇是直接將layer和style都設定好,這樣當我們加入feature到source中的時候,就可以直接渲染出來顯示圖案。
補充:新增feature的方式也有不同方法,可以透過geojson直接加入或是像這篇一個一個加入feature都是可以的。
// 建立空layer
let coffeeLayer = new ol.layer.Vector({
    // 設定空source
    source: new ol.source.Vector(),

    // 設定此layer feature style
    style: new ol.style.Style({
        image: new ol.style.Icon({
            anchor: [0.5, 1],
            anchorXUnits: 'fraction',
            anchorYUnits: 'fraction',
            src: 'coffee.png',
            scale: 0.1
        }),
    })
});

const map = new ol.Map({
    layers: [
        new ol.layer.Tile({
            source: new ol.source.OSM()
        }),
        coffeeLayer // layer在這
    ],
    target: 'map',
    view: new ol.View({
        projection: "EPSG:3857",
        center: ol.proj.fromLonLat([120.846642, 23.488793]),
        zoom: 7.5,
        maxZoom: 20,
        minZoom: 5,
        enableRotation: false,
    }),
    controls: []
});

function getCoffeeData() {
    axios.get("coffee.json")
        .then((res) => {
            // 解構資料
            let { data } = res;

            // 加入資料變成feature,注意座標轉換
            for (let i = 0; i < data.length; i++) {
                coffeeLayer.getSource().addFeature(
                    new ol.Feature({
                        geometry: new ol.geom.Point(
                            ol.proj.fromLonLat([
                                data[i]['longitude'],
                                data[i]['latitude']
                            ])
                        )
                    })
                )
            }
        })
        .catch((err) => {
            console.log(err)
        })
}

// 執行抓取API的function
getCoffeeData();
成果如下圖:
https://github.com/weijung0923/learning-openlayers-micromastery/tree/day11
