鑒於昨天做了個神奇的結果出來,跟朋友討論了一下,
(如下圖)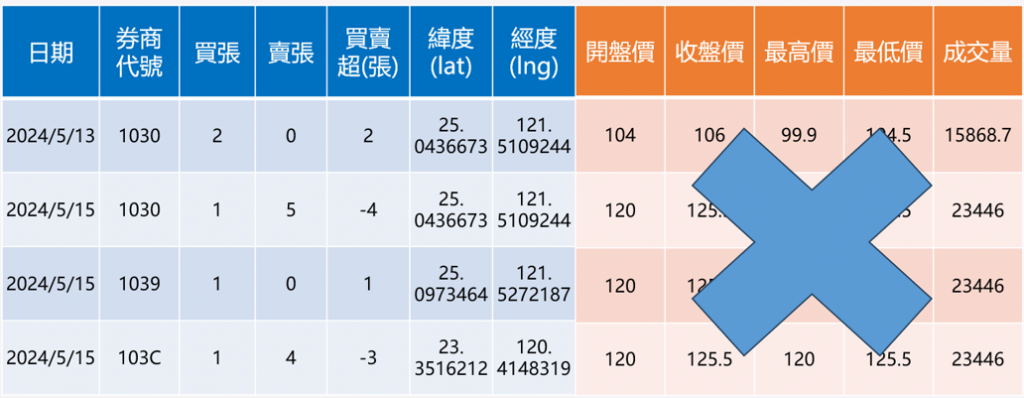
這個例子是以 所羅門(2359)
起漲的三天(5/13~5/15)來作為訓練資料,預測第四天(5/16)的券商籌碼行為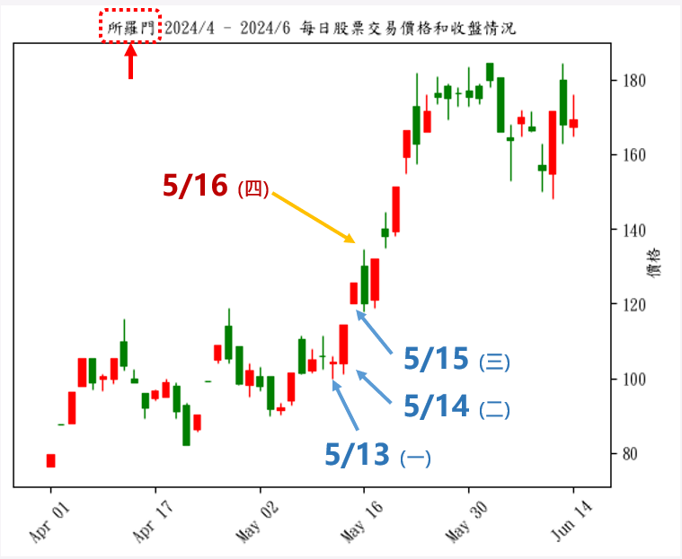
日期、券商代碼、買賣超(張),工人智慧,手動刪除其他欄位,另存檔案,
命名為Merged_to_train_ALL_trans.xlsx
日期	券商代碼	買賣超(張)
2024/05/13	1020	18
2024/05/14	1020	-19
2024/05/15	1020	3
2024/05/16	1020	37
2024/05/13	1021	-79
2024/05/14	1021	-17
2024/05/15	1021	-27
2024/05/16	1021	15
以日期作為欄位,每一列是每個券商當天對2359的買賣超行為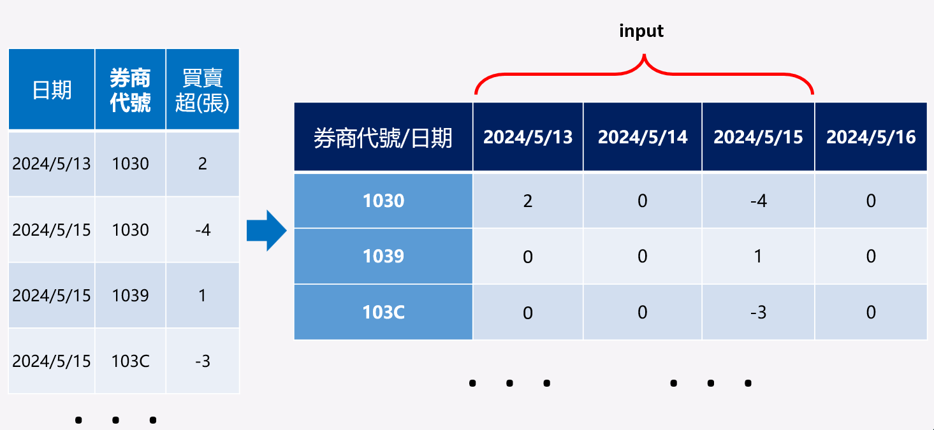
欄位轉置,程式碼如下
#資料讀進來
import pandas as pd
data = pd.read_excel('E:/時空資料分析/關鍵分點籌碼分析_實測/Merged_to_train_ALL_trans.xlsx')
data
日期 券商代碼 買賣超(張)
0 2024/05/13 1020 18
1 2024/05/14 1020 -19
2 2024/05/15 1020 3
3 2024/05/16 1020 37
4 2024/05/13 1021 -79
... ... ... ...
3178 2024/05/15 9A9Y -6
3179 2024/05/16 9A9Y 8
3180 2024/05/14 9A9Z -4
3181 2024/05/15 9A9Z -1
3182 2024/05/16 9A9Z 8
3183 rows × 3 columns
用 pivot_table 進行欄位轉置
df = pd.DataFrame(data)

# 將日期欄位的型態轉換為適當的格式
df['日期'] = pd.to_datetime(df['日期'])

pivot_df = df.pivot_table(index='券商代碼', columns='日期', values='買賣超(張)', fill_value=0, aggfunc='sum') #指定 aggfunc 為 'sum'

# 將每列資料的欄位名稱轉換格式
pivot_df.columns = pivot_df.columns.strftime('%Y/%m/%d')
print(pivot_df)
日期 2024/05/13 2024/05/14 2024/05/15 2024/05/16
券商代碼
1020 18 -19 3 37
1021 -79 -17 -27 15
1022 -18 -4 -2 17
1023 26 4 -7 38
1024 3 -30 -8 8
... ... ... ... ...
9A9j -4 6 39 -47
9A9q -5 8 -1 -26
9A9r 0 251 -21 -226
9A9s 0 -11 -4 8
9A9x -4 -27 -20 -15[811 rows x 4 columns]
成功轉置,另存成另一個檔案
pivot_df.to_excel('Merged_to_train_ALL_trans_New.xlsx', index=True)
從昨天的程式碼開始改造,
import numpy as np
import pandas as pd
import pylab as plt
from sklearn.preprocessing import MinMaxScaler
from tensorflow.keras.models import Sequential
#from keras.layers.convolutional import Conv3D
from tensorflow.keras.layers import ConvLSTM2D, Dense, Flatten
from tensorflow.keras.optimizers import Adam
把時間格式的資料值轉換成數值格式,其他都轉成NaN
# 資料表讀進來
import pandas as pd

dataOri= pd.read_excel('Merged_to_train_ALL_trans_New.xlsx')
dataOri

df = pd.DataFrame(dataOri)

# 將列轉換為數字,errors='coerce' 會將不可轉換的值轉換為 NaN
#to_numeric是在object,時間格式中間做轉換,然後再使用astype做數值類型的內部轉換
for col in df.columns[1:]:
    df[col] = pd.to_numeric(df[col], errors='coerce')

# 券商代碼當索引
df.set_index('券商代碼', inplace=True)
#df   # 印出來就跟上面一樣,只不過裡面的格式不一樣了
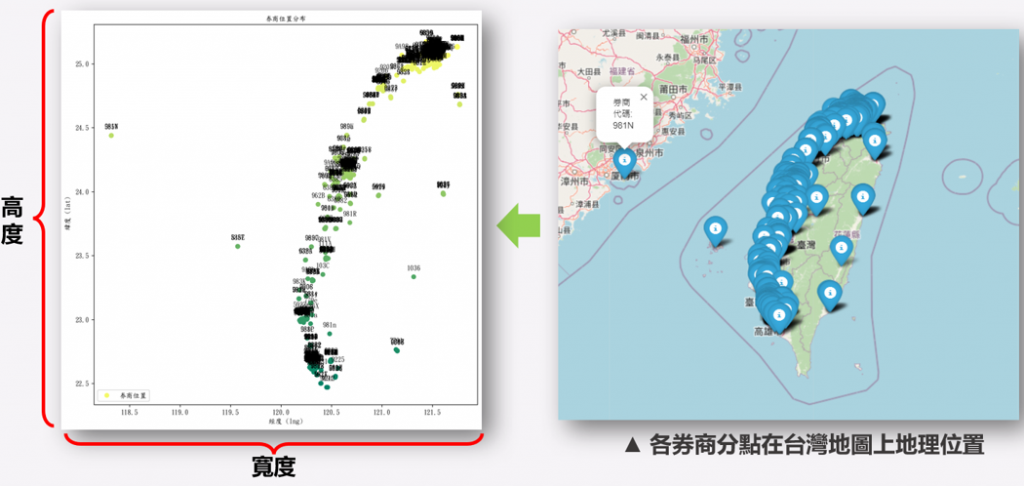
輸入x 應該為 (808,3, 分點台灣位置圖的寬度 width, 分點台灣位置圖的高度 Height, 1) ,
而 輸出y 應該為 (808,1) ;
中間跳過漫長的debug過程... ,之後有時間再補上來所有錯誤訊息,遇到時是怎麼修正的。
為了讓輸入和輸出的形狀符合模型,需要重新塑形
import numpy as np

# 創建時間序列資料
def create_sequences(data, time_steps=3):
    X, y = [], []
    for i in range(len(data) - time_steps):
        X.append(data[i:i+time_steps, :-1])  # 除了最後一欄的全部欄位資料
        y.append(data[i+time_steps, -1])     # 最後一欄: target
    return np.array(X), np.array(y)

# 最後一欄是我們要預測的目標,不包括在輸入資料中


data = df.values

# 創建輸入和輸出資料
X, y = create_sequences(data, time_steps=3)
# Print shapes of X and y
print("X shape before reshaping:", X.shape)
print("y shape:", y.shape)
X shape before reshaping: (808, 3, 3)
y shape: (808,)
samples, time_steps, features = X.shape
X = X.reshape((samples, time_steps, features, 1, 1))

# 檢查重塑後的形狀
print("Reshaped X shape:", X.shape)
print("y shape:", y.shape)
Reshaped X shape: (808, 3, 3, 1, 1)
y shape: (808,)
建立模型、設定起始參數,再次訓練第N次
model = Sequential([
    ConvLSTM2D(filters=64, kernel_size=(1, 1), input_shape=(time_steps, features, 1, 1), return_sequences=True),
    ConvLSTM2D(filters=32, kernel_size=(1, 1), return_sequences=False),
    Flatten(),
    Dense(50, activation='relu'),
    Dense(1)
])
model.compile(optimizer=Adam(learning_rate=0.001), loss='mse')
model.summary()

# 訓練模型 fit 下去
history = model.fit(X, y, epochs=50, batch_size=32, validation_split=0.1)
Layer (type) ┃ Output Shape ┃ Param # ┃
│ conv_lstm2d_12 (ConvLSTM2D) │ (None, 3, 3, 1, 64) │ 16,896 │
│ conv_lstm2d_13 (ConvLSTM2D) │ (None, 3, 1, 32) │ 12,416 │
│ flatten_6 (Flatten) │ (None, 96) │ 0 │
│ dense_12 (Dense) │ (None, 50) │ 4,850 │
│ dense_13 (Dense) │ (None, 1) │ 51 │
參數直接少了很多~ 訓練不到半小時就好了
Total params: 34,213 (133.64 KB)
Trainable params: 34,213 (133.64 KB)
Non-trainable params: 0 (0.00 B)
Epoch 1/50
23/23 ━━━━━━━━━━━━━━━━━━━━ 3s 22ms/step - loss: nan - val_loss: nan
Epoch 2/50
23/23 ━━━━━━━━━━━━━━━━━━━━ 0s 7ms/step - loss: nan - val_loss: nan. . .
Epoch 50/50
23/23 ━━━━━━━━━━━━━━━━━━━━ 0s 6ms/step - loss: nan - val_loss: nan
26/26 ━━━━━━━━━━━━━━━━━━━━ 1s 13ms/step
訓練結束把預測結果視覺化
import matplotlib.pyplot as plt

# 預測結果
predictions = model.predict(X)

# 畫成圖
plt.plot(predictions, label='Predicted')
plt.plot(y, label='Actual')
plt.legend()
plt.show()
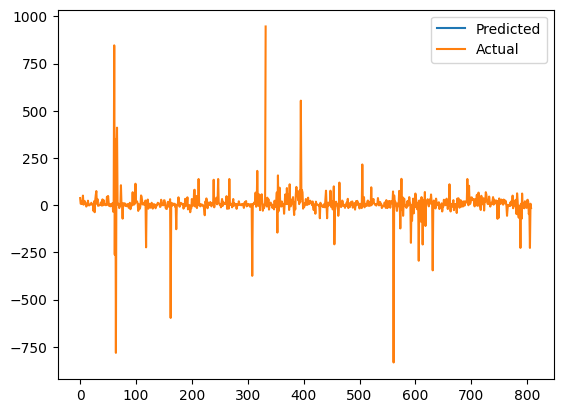
好像有點樣子...! 阿預測值怎麼還是甚麼都看不到= =
裡面的預測值印出來看一下
predictions
array([[nan],
[nan],
[nan],
[nan],
[nan],
[nan],
...
[nan],
[nan],
[nan],
[nan],
[nan]], dtype=float32)
原來不是太少看不到,而是根本就沒有值![]()
# 用MSE評估一下模型的性能
from sklearn.metrics import mean_squared_error

mse = mean_squared_error(y, predictions)
print("Mean Squared Error:", mse)
ValueError
---> 12 mse = mean_squared_error(y, predictions)ValueError: Input contains NaN.
有NaN 不能做評估...
最近好忙,看到這結果有點心累(?
差點以為做到崩掉,自己是在胡搞瞎搞。。。
今天累了,明天繼續!
參考文章&資料來源:
每日記錄:
加權指數收在22429.1點,上漲19.47點,交易量越縮越小,大家都在等美國的數據開獎,明天晚上有四個,
美國房貸綜合指數、美國DOE原油週庫存量、美國30年期房貸利率、美國15年期房貸利率,石油庫存量應該是增加,
石油增加-> 油價就便宜,
油價便宜-> 金價便宜 -> 股價上漲,連動關係。
