2D圖(空間資料)+籌碼買賣超資料(時序資料)當作輸入。具體步驟:
- 將時間序列資料擴展,為和圖像相同的形狀。
- 將圖像資料重塑,並擴展到時間步長(time step)。
- 將時間序列資料,與圖像資料合併。
import pandas as pd
import matplotlib.pyplot as plt
import numpy as np
from keras.models import Sequential
from keras.layers import ConvLSTM2D, Flatten, Dense
from tensorflow.keras.optimizers import Adam
from PIL import Image
from sklearn.model_selection import train_test_split
from sklearn.metrics import mean_squared_error
把那張政治正確的台灣分點散布圖拿出來,我取名broker_locations.png,
讀進來轉換成模型可以接受的大小。
# 讀取保存的圖像並轉換為資料矩陣
image = Image.open('broker_locations.png')
image = image.convert('L')  # 轉為灰度圖像
image = image.resize((100, 100), Image.Resampling.LANCZOS)  # 縮小圖像

data_matrix = np.array(image).astype(np.float32)
channels = 1

print("Reduced data matrix shape:", data_matrix.shape)
Reduced data matrix shape: (100, 100)
籌碼資料一樣讀進來
# 資料表讀進來
import pandas as pd

dataOri= pd.read_excel('Merged_to_train_ALL_trans_New.xlsx')
dataOri
df = pd.DataFrame(dataOri)

# Convert columns to numeric, errors='coerce' will convert non-convertible values to NaN
for col in df.columns[1:]:
    df[col] = pd.to_numeric(df[col], errors='coerce')

# 設置券商代碼為索引
df.set_index('券商代碼', inplace=True)
中間試錯了一些,為了看形狀,都變成註解的東西
# 創建時間序列資料
def create_sequences(data, time_steps=3):
    X, y = [], []
    for i in range(len(data) - time_steps):
        X.append(data[i:i+time_steps, :])  # Use all columns  :-1
        y.append(data[i+time_steps, -1])     # Use the last column as the target
    return np.array(X), np.array(y)

data = df.values

# 創建輸入和輸出資料
X, y = create_sequences(data, time_steps=3)


# Print shapes of X and y
print("X shape before reshaping:", X.shape)
print("y shape:", y.shape)

# 步驟2:準備模型輸入
# 假設這裡有樣本數808,時間步長3
samples, time_steps,features = X.shape
#, features
width = data_matrix.shape[1]
height = data_matrix.shape[0]
#channels = 1
X shape before reshaping: (808, 3, 4)
y shape: (808,)
眼尖的朋友應該會發現昨天是808,3,3 ...
X_train, X_test, y_train, y_test = train_test_split(X, y, test_size=0.2, random_state=1024)
(一堆犧牲的死亡註解,就像戰場上被射穿的弟兄,留著可能還可以擋子彈)
# 建立圖像資料
width = data_matrix.shape[1]
height = data_matrix.shape[0]

# 將時間序列資料擴展為與圖像資料相同的形狀
def expand_data(X, width, height):
    X_expanded = np.repeat(X[:, :, np.newaxis, np.newaxis, :], width, axis=2)
    X_expanded = np.repeat(X_expanded, height, axis=3)
    return X_expanded
#X_expanded = np.repeat(X[:, :, np.newaxis, np.newaxis, :], width, axis=2)
#X_expanded = np.repeat(X_expanded, height, axis=3)

X_train_expanded = expand_data(X_train, width, height)
X_test_expanded = expand_data(X_test, width, height)

image_data_train = np.tile(data_matrix[np.newaxis, np.newaxis, :, :, np.newaxis], (X_train.shape[0], X_train.shape[1], 1, 1, 1))
image_data_test = np.tile(data_matrix[np.newaxis, np.newaxis, :, :, np.newaxis], (X_test.shape[0], X_test.shape[1], 1, 1, 1))

#image_data = np.tile(data_matrix[np.newaxis, np.newaxis, :, :, np.newaxis], (samples, time_steps, 1, 1, 1))

# 合併時間序列資料和圖像資料
combined_data_train = np.concatenate((X_train_expanded, image_data_train), axis=-1)
combined_data_test = np.concatenate((X_test_expanded, image_data_test), axis=-1)
#combined_data = np.concatenate((X_expanded, image_data), axis=-1)

# 檢查合併後的形狀
print("Combined train data shape:", combined_data_train.shape)
print("Combined test data shape:", combined_data_test.shape)
#print("Combined data shape:", combined_data.shape)
#Combined data shape: (808,3,100,100,5)
#print("X_expanded shape:", X_expanded.shape)
#X_expanded shape: (808,3,100,100,4)
#print("image_data shape:", image_data.shape)
#image_data shape: (808,3,100,100,1)

#X = X.reshape((samples, time_steps, features, width, height, channels))
#
Combined train data shape: (646, 3, 100, 100, 5)
Combined test data shape: (162, 3, 100, 100, 5)
資料塑形完畢,模型建立是必須的
model = Sequential([
    ConvLSTM2D(filters=64, kernel_size=(1, 1), input_shape=(combined_data_train.shape[1:]), return_sequences=True),
    ConvLSTM2D(filters=32, kernel_size=(1, 1), return_sequences=False),
    Flatten(),
    Dense(50, activation='relu'),
    Dense(1)
])


model.compile(optimizer=Adam(learning_rate=0.001), loss='mse')
model.summary()

# 建立好,給他fit下去
history = model.fit(combined_data_train, y_train, epochs=50, batch_size=32, validation_split=0.1)
#history = model.fit(combined_data, y, epochs=50, batch_size=32, validation_split=0.1)
輸出結果透露了有個人做出了五個不一樣的模型><
Model: "sequential_5"
┃ Layer (type) ┃ Output Shape ┃ Param # ┃
│ conv_lstm2d_10 (ConvLSTM2D) │ (None, 3, 100, 100, 64)│ 17,920 │
│ conv_lstm2d_11 (ConvLSTM2D) │ (None, 100, 100, 32) │ 12,416 │
│ flatten_5 (Flatten) │ (None, 320000) │ 0 │
│ dense_8 (Dense) │ (None, 50) │ 16,000,050 │
│ dense_9 (Dense) │ (None, 1) │ 51 │
Total params: 16,030,437 (61.15 MB)
Trainable params: 16,030,437 (61.15 MB)
Non-trainable params: 0 (0.00 B)
Epoch 1/50
23/23 ━━━━━━━━━━━━━━━━━━━━ 59s 2s/step - loss: nan - val_loss: nan
Epoch 2/50
23/23 ━━━━━━━━━━━━━━━━━━━━ 47s 2s/step - loss: nan - val_loss: nan
. . .
Epoch 50/50
23/23 ━━━━━━━━━━━━━━━━━━━━ 41s 2s/step - loss: nan - val_loss: nan
26/26 ━━━━━━━━━━━━━━━━━━━━ 19s 690ms/step
很好很好,那個參數量到底是甚麼鬼,1600萬????
怪不得訓練很久...
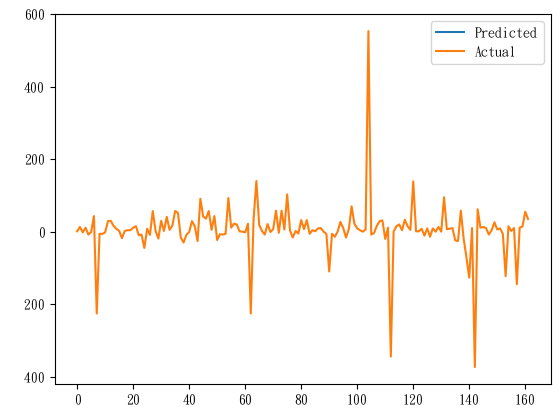
圖就印出來看,就完事了
predictions = model.predict(combined_data_test)

plt.plot(predictions, label='Predicted')
plt.plot(y_test, label='Actual')
plt.legend()
plt.show()

的確完事了,這張圖就跟心電圖一樣,等一下我的心就涼了 (沒
嗯... 要是覺得模型有用處想留,可以用下面這段程式碼保留住訓練不易的模型。
joblib這個工具### 儲存模型
import joblib
# 儲存模型至指定路徑
joblib.dump(model, 'trainModel_0821.joblib')
三天搞模型,三天都產出不一樣的圖@@
我是大巫師嗎(? 資料丟進大魔鍋,出來啥全靠命(誤
容我再好好思考哪裡出了錯誤QQ
參考文章&資料來源:
每日記錄:
加權指數收在22237.89點,下跌191.21點,連續漲了快2個禮拜,終於收盤跌了。
美股那個預測,非農數據人數下調,就很危險,最高可能下修100萬人(超多,
美國非農數據最高恐下修百萬人 Fed面臨就業市場難題
這幾天的部分不像前面那麼有趣,尤其是模型的部分,漫長乏味,還要一直試錯。
我是不會放棄的! 就像殺不死的蟑螂一樣...(聽起來好像有點嘔心(?
又不是孔明,三顧模型...
