在單元線性回歸的例子中,用到年資去預測薪水,但實際上會考慮到更多條件,所以這個時候就可以用多元線性回歸,囊括更多的feature去預測結果。
單元線性回歸:y = w.x + b
多元線性回歸:y = w1.x1 + w2.x2 + w3.x3 + ... + b
import pandas as pd
url = "https://raw.githubusercontent.com/GrandmaCan/ML/main/Resgression/Salary_Data2.csv"
data = pd.read_csv(url)
data
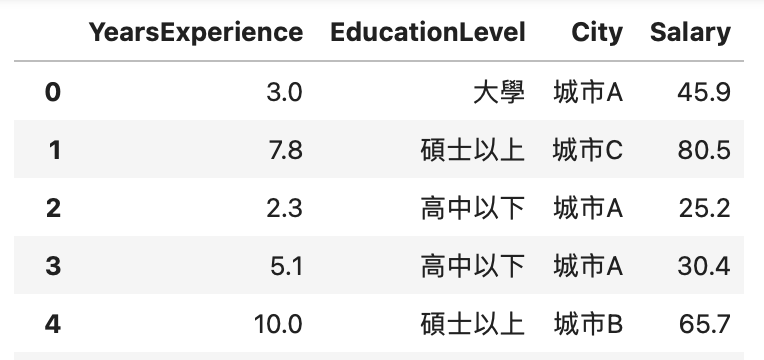
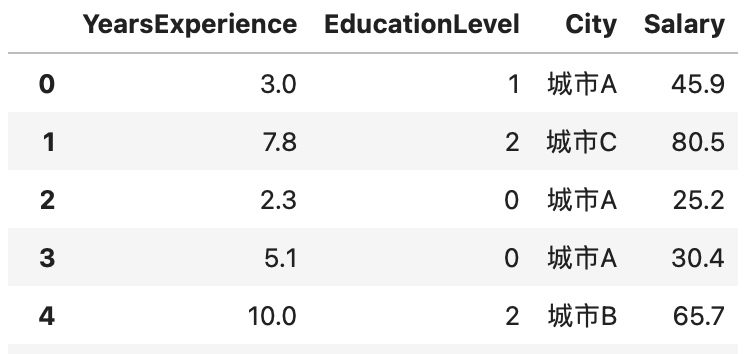
label encoding =>資料處理:依照學歷高低給予不同數字(高中以下:0、大學:1、碩士以上:2)
data["EducationLevel"] = data["EducationLevel"].map({"高中以下":0, "大學":1, "碩士以上":2})
data
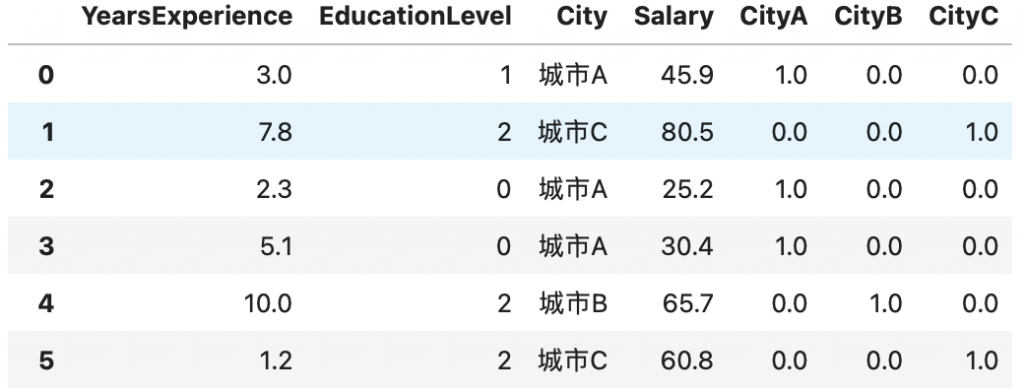
one hot encoding =>資料處理:城市,因為無法清楚區分高低,所以拆成多個特徵來儲存資料
此資料裡面包涵cityA, cityB, and cityC,假設樣本為cityA =>
則在資料拆分後,可變成(cityA, cityB, cityC) = (1, 0, 0),
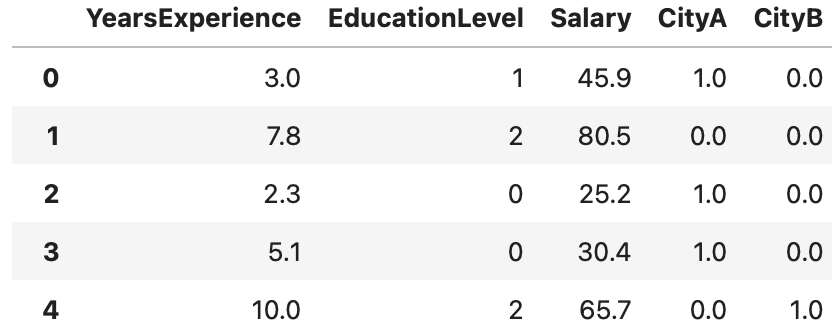
其實可以刪掉其中一個特徵,若把cityC刪除,cityA = (1, 0), cityB = (0, 1), cityC = (0, 0)。
<不一定要刪掉某個特徵>
from sklearn.preprocessing import OneHotEncoder

onehot_encoder = OneHotEncoder()
onehot_encoder.fit(data[["City"]]) #二維矩陣所以用[[]]
city_encoded =  onehot_encoder.transform(data[["City"]])
city_encoded
#輸出:
<36x3 sparse matrix of type '<class 'numpy.float64'>'
	with 36 stored elements in Compressed Sparse Row format>
將資料加入原本的表格中:
data[["CityA", "CityB", "CityC"]] = city_encoded
data
將原本的City以及CityC列刪除:
data = data.drop(["City", "CityC"], axis = 1)
data
from sklearn.model_selection import train_test_split

x = data[["YearsExperience", "EducationLevel", "CityA",	"CityB"]]
y = data["Salary"]

x_train, x_test, y_train, y_test = train_test_split(x, y, test_size = 0.2, random_state = 87)
#轉換成numpy比較好計算
x_train = x_train.to_numpy()
x_test = x_test.to_numpy()
y_train = y_train.to_numpy()
y_test = y_test.to_numpy()
sklearn.preprocessing 模塊中的 StandardScaler 來對數據進行標準化處理。
from sklearn.preprocessing import StandardScaler

scaler = StandardScaler()
scaler.fit(x_train)
x_train = scaler.transform(x_train)
x_test = scaler.transform(x_test)
import numpy as np

w = np.array([1, 2, 3, 4])
b = 1

y_pred = (x_train*w).sum(axis = 1) + b

def compute_cost(x, y, w, b):
    y_pred = (x*w).sum(axis = 1) + b
    cost = ((y - y_pred)**2).mean()
    return cost
import numpy as np

w = np.array([1, 2, 3, 4])
b = 1
compute_cost(x_train, y_train, w, b)
#輸出:1772.9485714285713
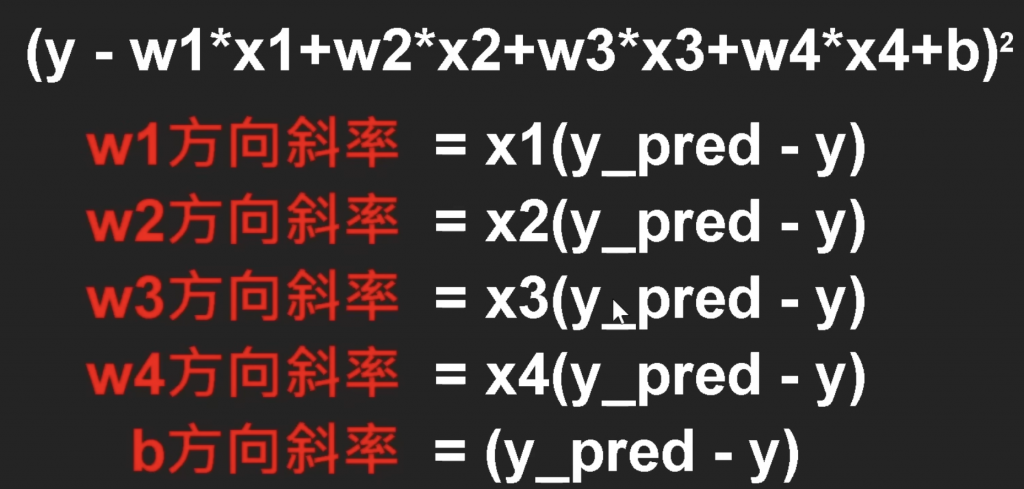
y_pred = (x_train*w).sum(axis = 1) + b
b_gradient = (y_pred - y_train).mean()
w_gradient = np.zeros(x_train.shape[1])

for i in range(x_train.shape[1]):
     w_gradient[i] = (x_train[:, i]*(y_pred - y_train)).mean()

w_gradient, b_gradient
np.set_printoptions(formatter = {"float": "{: .2e}".format})
def gradient_descent(x, y, w_init, b_init, learning_rate, cost_function, gradient_function, run_iter, p_iter = 1000):
    c_hist = []
    w_hist = []
    b_hist = []

    w = w_init
    b = b_init
    for i in range(run_iter):
        w_gradient,  b_gradient = gradient_function(x, y, w, b)

        w = w -  w_gradient*learning_rate
        b = b -  b_gradient*learning_rate
        cost = cost_function(x, y, w, b)

        w_hist.append(w)
        b_hist.append(b)
        c_hist.append(cost)

        if i%p_iter == 0:
            print(f"Ieration {i:5}: cost{cost: .4e}, w:{w}, b:{b: .2e}, w_gradient:{w_gradient }, b_gradient:{b_gradient: .2e}")

    return w, b, w_hist, b_hist, c_hist
w_init = np.array([1, 2, 2, 4])
b_init = 0
learning_rate = 1.0e-2
run_iter = 10000

w_final, b_final, w_hist, b_hist, c_hist = gradient_descent(x_train, y_train, w_init, b_init, learning_rate, compute_cost, compute_gradient, run_iter, p_iter = 1000)
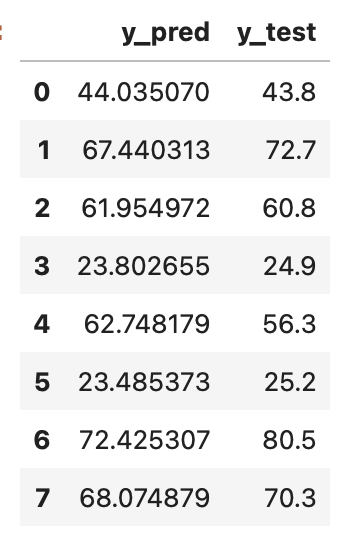
y_pred = (w_final*x_test).sum(axis = 1) + b_final

pd.DataFrame({
    "y_pred" : y_pred,
    "y_test" : y_test
})
# 5.3 碩士以上 城市A
# 7.2 高中以下 城市B
x_real = np.array([[5.3, 2, 1, 0], [7.2, 0, 0, 1]])
x_real = scaler.transform(x_real)
y_real = (w_final*x_real).sum(axis=1) + b_final
y_real
