昨天已經有初步成果,能夠在python中建立矩陣計算系統,並且用matplotlib畫出對x軸的弧度變化。
BUT!!!
誰在乎弧度變化呢?人類需要能夠直接看到光線路線!因此第七天就來嘗試,將Y軸改為位置,看看能否畫出通過介質和透鏡後的路線。
接下來使用 Python 進行計算
import numpy as np
import matplotlib.pyplot as plt
# 定義ABCD矩陣
def abcd_matrix(A, B, C, D):
return np.array([[A, B], [C, D]])
# 透鏡的ABCD矩陣 (焦距為 f 的薄透鏡)
def thin_lens(f):
return abcd_matrix(1, 0, -1/f, 1)
# 傳播距離為 d 的介質ABCD矩陣
def propagation(d, n=1): # n 是折射率
return abcd_matrix(1, d/n, 0, 1)
# 初始光線狀態
incident_ray = np.array([0, 0.1]) # 位置 r = 0, 弧度 θ = 0.1 rad
# 定義光學系統
lens1 = thin_lens(10) # 焦距為 10 的透鏡
medium = propagation(5) # 傳播距離為 5 的介質
lens2 = thin_lens(-5) # 焦距為 -5 的凹透鏡
# 光學系統中各點的光線狀態
rays = [incident_ray]
# 計算光線經過每個元件後的狀態
rays.append(np.dot(medium, rays[-1])) # 介質
rays.append(np.dot(lens1, rays[-1])) # 第1個透鏡
rays.append(np.dot(medium, rays[-1])) # 介質
rays.append(np.dot(lens2, rays[-1])) # 第2個透鏡
rays.append(np.dot(medium, rays[-1])) # 介質
# 可視化光路
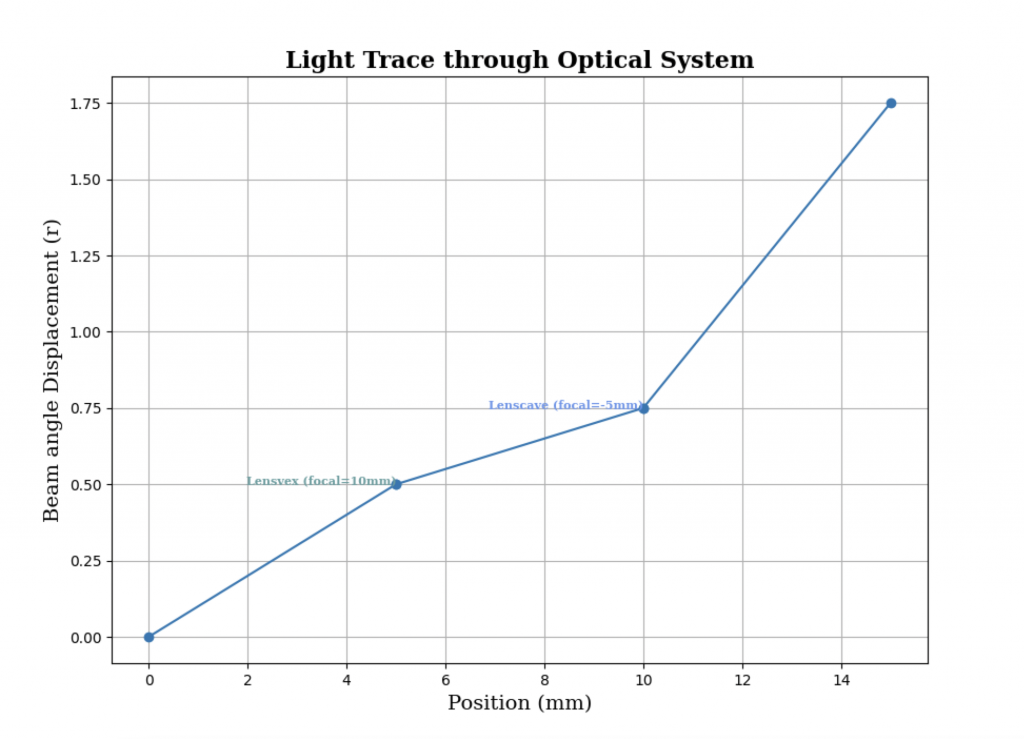
x_positions = [0, 5, 5, 10, 10, 15] # 每個元件的位置
angles = [ray[1] for ray in rays] #光線矩陣中的第二個項目
print(angles)
#根據斜率和距離算出Y軸高度
x_distances = np.diff(x_positions) #不同位置間的距離
heights = [0] #設定初始Y軸高度
print(x_distances)。#確認距離計算是否正確
for i in range(len(x_distances)):
height = heights[-1] + x_distances[i] * float(angles[i])
heights.append(height)
print(heights)
y_positions = heights
#這裏我們加入迴圈,藉由不斷帶入各個間距算出每段變化量,並加入heights這個list中。
plt.figure(figsize=(10, 10))
plt.plot(x_positions, y_positions, marker='o')
# 添加標籤,並指定字體屬性
plt.text(5, y_positions[1], 'Lensvex (focal=10mm)', fontsize=8, fontfamily='serif', fontweight='bold', ha='right', color='cadetblue')
plt.text(10, y_positions[4], 'Lenscave (focal=-5mm)', fontsize=8, fontfamily='serif', fontweight='bold', ha='right', color='cornflowerblue')
plt.title('Light Trace through Optical System', fontsize=16, fontfamily='serif', fontweight='bold')
plt.xlabel('Position (mm)', fontsize=14, fontfamily='serif')
plt.ylabel('Beam angle Displacement (r)', fontsize=14, fontfamily='serif')
plt.grid(True)
plt.show()
登登!(經過人工驗算後)修改過的程式碼跑出來的圖_終於是光的路徑!是不是比較直觀了呢~
這裡迴圈的用法,我是將斜率和高度的計算公式丟給chatgpt,問說該如何計算而得出的,不過在圖像化的過程中,plt.plot(x_positions, y_positions, marker=‘o’)中y_positions,不能直接使用heights去跑圖的Y軸問題,說是維度不一致。
雖然不知道為什麼,但我靈光一閃assign heights to y_positions,然後用y_positions就能跑圖了。
如果有大神路過可以幫忙解釋一下就太感激了QQ
以上第七天ABCD MATRIX篇完~請繼續期待明天唷!

 iThome鐵人賽