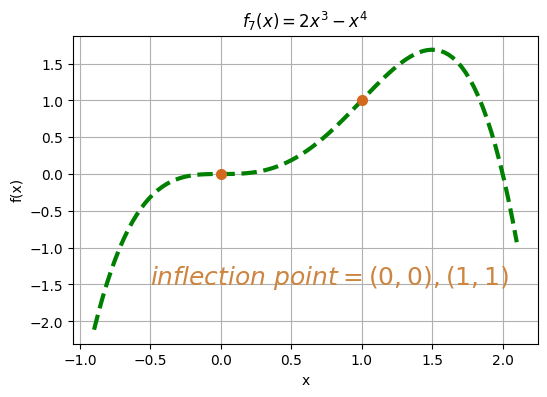
函數 7 圖形如下,有反曲點 (0, 0), (1, 1)。Python 程式碼如下,不直接輸入函數,而是用p=[-1, 2, 0, 0] 設定多項式之係數,降幕排列,其中最右側的一項為常數項的係數。往左一格為 x 多一次方的係數。之後,配合 def f(x): return np.polyval(p, x) 定義 f(x) 的值。
# function 7: f(x) = 2*x^3 - x^4

xmin, xmax = -0.9, 2.1
x = np.linspace(xmin, xmax, 100)
p = [-1, 2, 0, 0, 0] # 多項式之係數
def f(x): return np.polyval(p, x) # 多項式

fig = plt.figure(figsize=(6, 4))

# use axis object
ax = plt.gca()
ax.plot(x, f(x), linewidth=3, color='green', linestyle='--')
plt.plot(0, 0, marker='o', color='chocolate', markersize=7)
plt.plot(1, 1, marker='o', color='chocolate', markersize=7)

plt.text(-0.5, -1.5, '$inflection \ point = (0, 0), (1, 1)$', color='peru', \
         fontsize=18, style='italic')

plt.xlabel('x')
plt.ylabel('f(x)')
plt.title('$f_7(x) = 2x^3 - x^4$')
plt.grid(True)


# plt.savefig(os.path.join(_save_path, (day_no + str(image_counter) + '.png')))
# plt.savefig(os.path.join(_save_path, (image_name[image_name.find('/')+1:])))

plt.show()

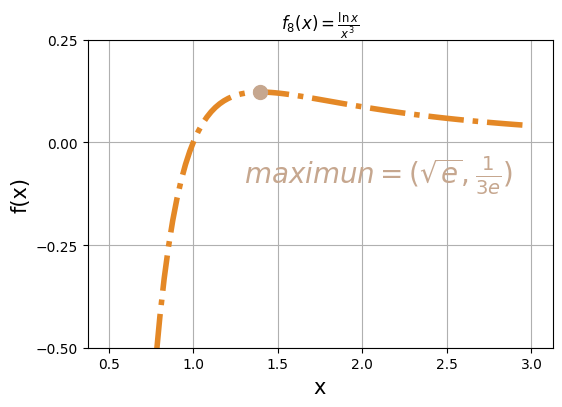
函數 8 圖形如下,此函數若進進觀察可以發現有反曲點,在此也是最大值。但是,如果放遠來看,該最大值發生的地方就看不出來有反曲點的特性,只能大概看出可能存在一條水平進漸線。
Python 程式碼如下,此函數的定義於係為 {x: x > 0},所以在畫此函數時,不應從 x > 0 開始畫,而是應從比 0 大一點點的地方開始畫,在此本文選擇設定 xmin = 0.5。另外,須注意 numpy 函數庫中 np.exp(*) 為指數函數,需設置其次方,例如:np.exp(1),括弧內不可空白,程式才可正常運作。
# function 8: f(x) = ln(x) / x^3

xmin, xmax = 0.5, 3 # f(x) 在 x=0 不存在
ymin, ymax = -0.5, 0.25
x = np.linspace(xmin, xmax, 100)

def f(x): return np.log(x) / (x**3)

fig = plt.figure(figsize=(6, 4))

# use axis object
ax = plt.gca()
ax.plot(x, f(x), color='#e48826', linewidth=4, linestyle='-.')
ax.plot(np.cbrt(np.exp(1)), 1/(3 * np.exp(1)), marker='o', color='#c6a78f', markersize=10)

plt.text(1.3, -0.1, r'$maximun = (\sqrt{e}, \frac{1}{3e})$', fontsize=20, color='#c6a78f')

# ax.grid(True)
ax.set_xlabel('x', fontsize=15)
ax.set_ylabel('f(x)', fontsize=15)
ax.set_xticks(np.arange(xmin, xmax + 0.5, 0.5))
ax.set_ylim([ymin, ymax])
ax.set_yticks(np.arange(ymin, ymax + 0.25, 0.25))

ax.set_xlabel('x')
ax.set_ylabel('f(x)')
ax.set_title(r'$f_8(x) = \frac{\ln{x}}{x^3}$')
ax.grid(True)

plt.show()

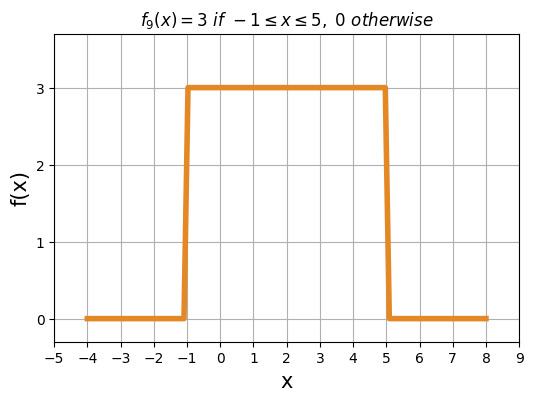
函數 9 的圖形如下,為一條界於 -1 <= x <= 5 的水平線。Python 程式碼如下,存在 4 種方法表示函數。第 1 類為使用 if else 判斷配合 map(*) 函數,前面放函數,後面放可迭代(iterable)的物件,把定義的函數蝶帶到各個元素之上,再把不能直接用來畫圖的 map 物件轉換為 list ,即轉成陣列的形式與 x 一同作圖。第 2 類為使用指標函數(indicator funtion) 的概念對 x 陣列進行計算,一次完成計算結果。實測 4 種方法有可以正確畫出函數 9。
# function 9: f(x) = 3 if -1<=x<=5, 0 otherwise

xmin, xmax = -5, 7
x = np.linspace(xmin, xmax, 100)

# 共 4 種方式
# 第 1 類 - if ... else ... 配合 map(*)
def f91(x):
  if x >= -1 and x <= 5:
    return 3
  else:
    return 0

# 第 2 類 - 向量方法: 指標函數(indicator function)
def f92(x): return np.where(np.logical_and(x >= -1, x <= 5), 3, 0)
def f93(x): return 3 * (x >= -1) * (x <= 5)
def f94(x): return (-3) * (x > 5) + (-3) * (x < -1) + 3


fig = plt.figure(figsize=(6, 4))

# use axis object
ax = plt.gca()

ax.plot(x, list(map(f91, x)), color='#e48826', linewidth=4, linestyle='-')
# ax.plot(x, f92(x), color='#e48826', linewidth=4, linestyle='-')
# ax.plot(x, f93(x), color='#e48826', linewidth=4, linestyle='-')
# ax.plot(x, f94(x), color='#e48826', linewidth=4, linestyle='-')

ax.set_xlabel('x', fontsize=15), ax.set_ylabel('f(x)', fontsize=15)
ax.set_xticks(np.arange(xmin-1, xmax+2, 1))
ax.set_yticks(np.arange(0, 5, 1))
ax.set_ylim([-0.3, 3.7])
ax.set_title(r'$f_9(x) = 3 \ if \ -1 \leq x  \leq 5, \ 0 \ otherwise$' )
ax.grid(True)

plt.show()

