雖然近期討論Sentry幾乎都是在前端的錯誤監控,但別忘了當初Sentry在最一開始的開發目的,是為了處理Django後端的日誌問題和錯誤報警。接下來,我們就來看一下Sentry和後端服務的接合是如何,不過筆者比較熟悉NodeJS,所以大部分的demo會以NodeJS為主
簡單基於express來寫一個後端server:
index.js
const express = require('express');
const cors = require('cors');

const { SENTRY_DSN, PORT } = require('./config');

const app = express();

app.use(cors());
app.get('/', (req, res) => {
    res.send('hello nodejs with sentry');
});
app.listen(PORT, () => {
    console.log(`NodeJS server in: http://localhost:${PORT}`);
});
@sentry/tracing,但在 7.47.0版本之後就不需要了)pnpm add @sentry/node @sentry/profiling-node
const Sentry = require('@sentry/node');
const { nodeProfilingIntegration } = require('@sentry/profiling-node');

const { SENTRY_DSN, PORT } = require('./config');

// Ensure to call this before requiring any other modules!
Sentry.init({
    dsn: SENTRY_DSN,
    integrations: [
        // Add our Profiling integration
        nodeProfilingIntegration(),
    ],

    // Add Tracing by setting tracesSampleRate
    // We recommend adjusting this value in production
    tracesSampleRate: 1.0,

    // Set sampling rate for profiling
    // This is relative to tracesSampleRate
    profilesSampleRate: 1.0,
});
...

app.get('/', (req, res) => {
    res.send('hello nodejs with sentry');
});
app.get('/demo-01', (req, res) => {
    res.json({ message: 'demo api successfully' });
});
// The error handler must be registered before any other error middleware and after all controllers
Sentry.setupExpressErrorHandler(app);
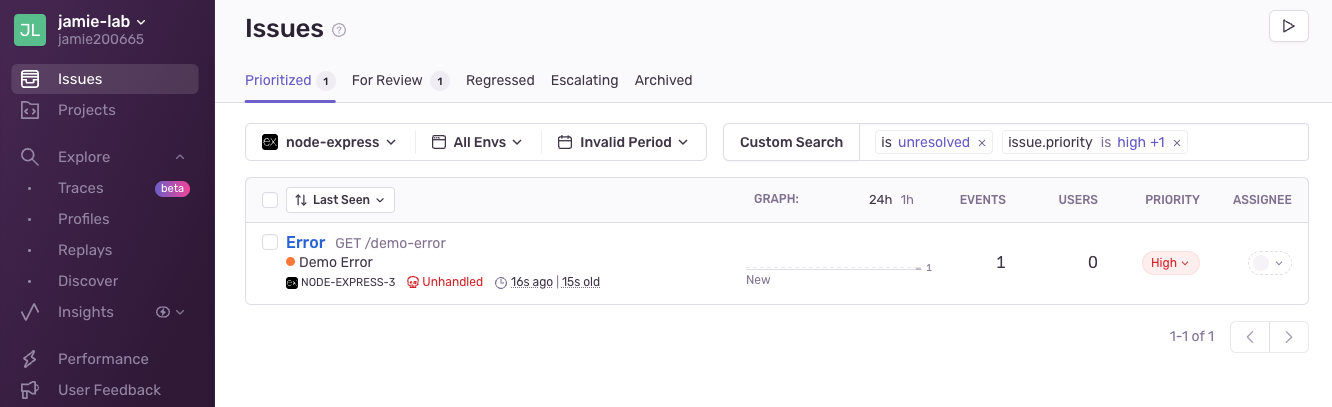
這樣一來,Sentry SDK就可以捕捉在這個express應用中的錯誤,上報到Sentry 平台。
app.get('/demo-error', (req, res) => {
    throw new Error("Demo Error")
});
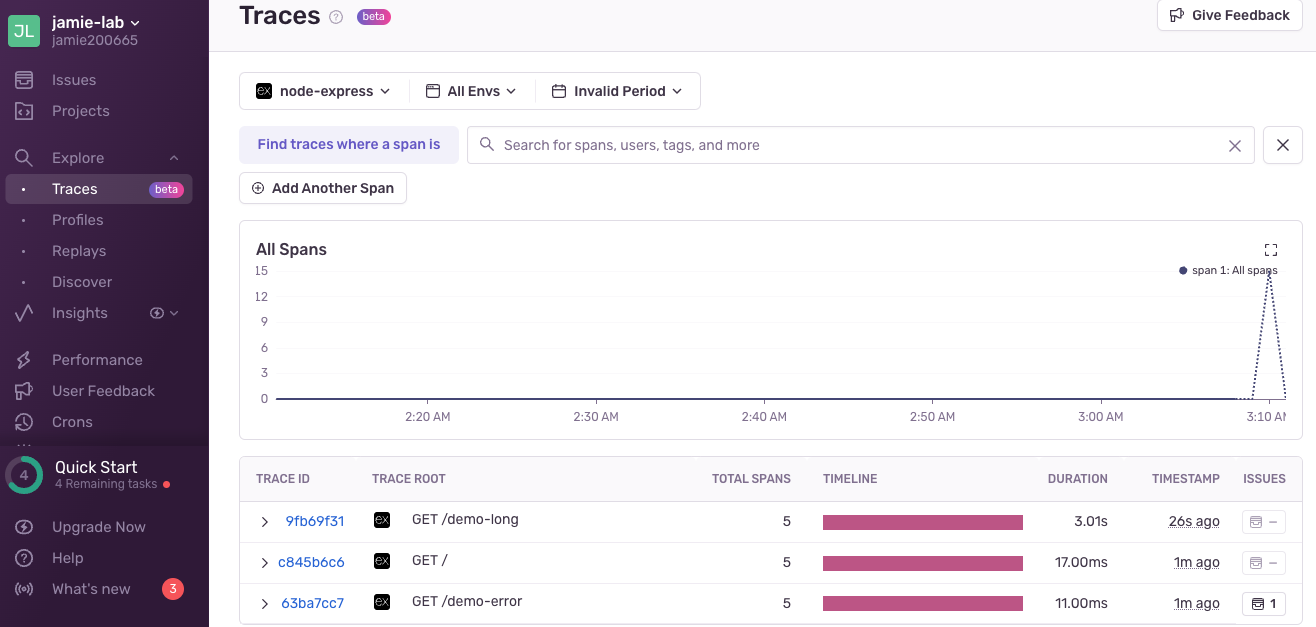
app.get('/demo-long', async (req, res) => {
    await sleep(3000);
    res.json({ message: 'demo api successfully' });
});
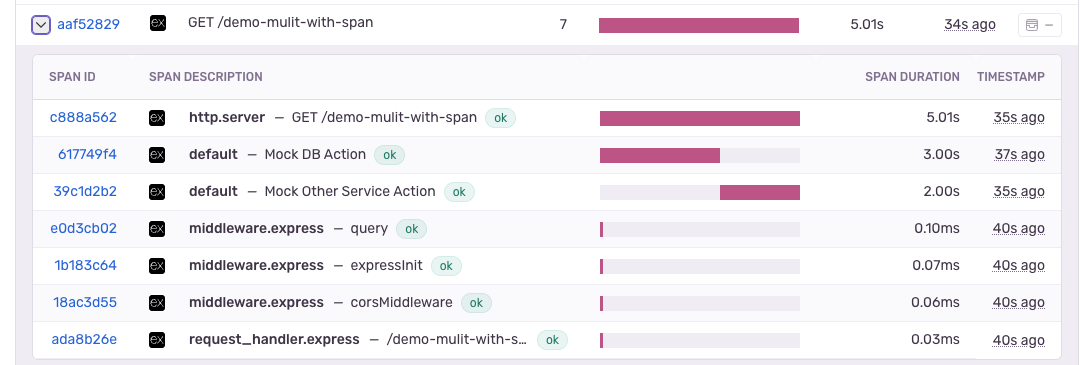
app.get('/demo-mulit-with-span', async (req, res) => {
    try {
        const dbResult = await Sentry.startSpan(
            {
                name: 'Mock DB Action',
            },
            async () => {
                // mock db
                await sleep(3000);
                return 'finsh db';
            },
        );
        const otherResult = await Sentry.startSpan(
            {
                name: 'Mock Other Service Action',
            },
            async () => {
                // mock db
                await sleep(2000);
                return 'finsh other service';
            },
        );

        res.json({ message: 'finish multi-action ' });
    } catch (err) {
        Sentry.captureException(err);
        res.status(500).send('Error Happened');
    }
});
今天我們簡單在NodeJS中結合Sentry,並且mock一些場景來看Sentry會如何展示。接下來我們將深入理解Sentry是如何對NodeJS應用進行監控的。