前幾篇介紹了怎們怎 PromQL 查詢時間序列資料,這篇來看看我們要怎麼對 Prometheus 寫入資料。
一般 Prometheus 寫入資料的方式就只有一種:由 Prometheus 主動週期性從標的 http 拉取。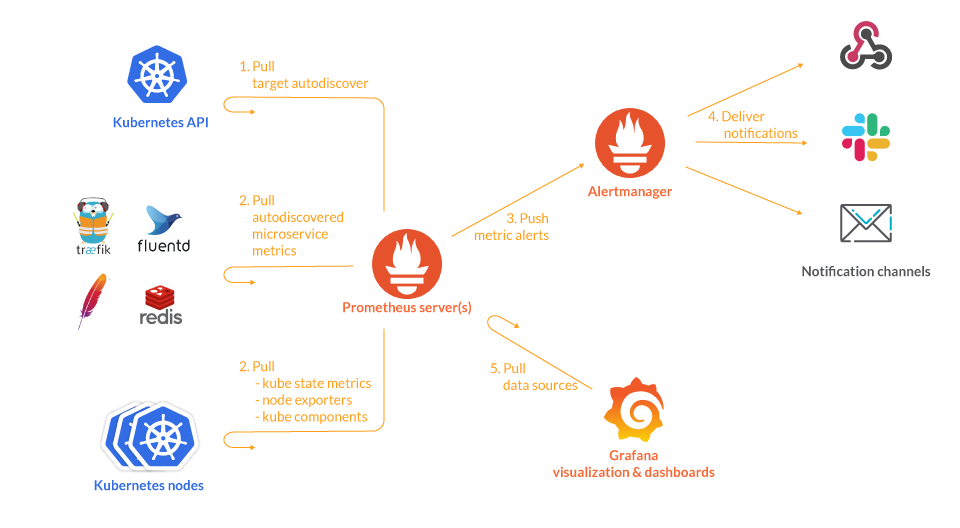
圖片來源:https://sysdig.com/blog/kubernetes-monitoring-prometheus/
所以在要讓資料寫入 Prometheus 至就要做兩件事:
我們下面分別討論。
從 Prometheus 的角度來看,標的就是一個 http 服務,提供 /metrics 端點,依指定格式回傳時間序列資料。但凡有固定的格式,就會有人實作成不同語言的函式庫。
注意到這些套件被稱為 (prometheus) client library,但這些 Prometheus 客戶函式庫是實作一個 http server,而不是 http client。 Prometheus Server 才是發出 http request 的 http client。
這些標的函式庫自然要提供一些好用的介面,也就是之前提到的資料型態,相當於 OpenMetrics 的指標族。使用上只要操作這些指標族,它們的值就會正確地反應在 Prometheus 拉到的 http response 裡。
而這些函式庫的實作也並非毫無難度,因為要考慮到效能和資料一致性的問題。比方說 Histogram,我們可不希望 race condition 造成如下 le 標籤值增加樣本值卻減少的狀況:
# HELP http_request_duration_seconds The HTTP request latencies in seconds.
# TYPE http_request_duration_seconds Histogram
http_request_duration_seconds_bucket{le="0.1"} 10
http_request_duration_seconds_bucket{le="0.2"} 50
http_request_duration_seconds_bucket{le="0.4"} 110
http_request_duration_seconds_bucket{le="0.8"} 150
http_request_duration_seconds_bucket{le="1.6"} 149
上述是透過函式庫,把指標族寫進 code 裡,由該進程提供 http 端口。
但有時候我們可能要監控的標的並不是我們自己的程式,而是一些常見的第三方的服務。這時候我們可以透過exporter來把這些指標轉換成 Prometheus 的格式。
此外,Prometheus 還考慮到有些情況下,相關進程的執行時間太短,無法等到 Prometheus 來拉就已經消滅。於是提供 Push Gateway 做為一個緩衝區,讓進程可以把指標推到 Push Gateway,再由 Prometheus 定時從 Push Gateway 拉取。
要讓 Prometheus 知道標的位置,最簡單的方式就是在 Prometheus 的設定檔裡寫下所有標的位置。然而多數使用場景下,標的會動態增減,維護這個標的列表的機制稱為 Service Discovery。
如上 promethues client 一般,Service Discovery 也有最一般的實作方式:檔案系統或 http。
然而實務上,常用到的平台 Prometheus 都有支援了,例如 Kubernetes、Consul、EC2 等等。只要寫好設定檔就可以用了。
之前提到 Prometheus 有遠端寫入的功能,他可以把拉到的資料寫入下游,而下游可以是另一臺 Prometheus。
下游的 Prometheus 是需要開啟 --web.enable-remote-write-receiver 設定。才能從/api/v1/write接收資料。
至於名字相近的 Remote Read 功能,他是讓 Prometheus 從下游拉資料,而不儲存。這個功能是為了讓 Prometheus 可以用下游(如 Thanos)的資料來處理 PromQL 查詢。
Prometheus 從標的拉到的資料後,並不是直接寫入資料庫,而是先經過一些處理。這個處理包括:
這其中各有小問題可以問:


 iThome鐵人賽