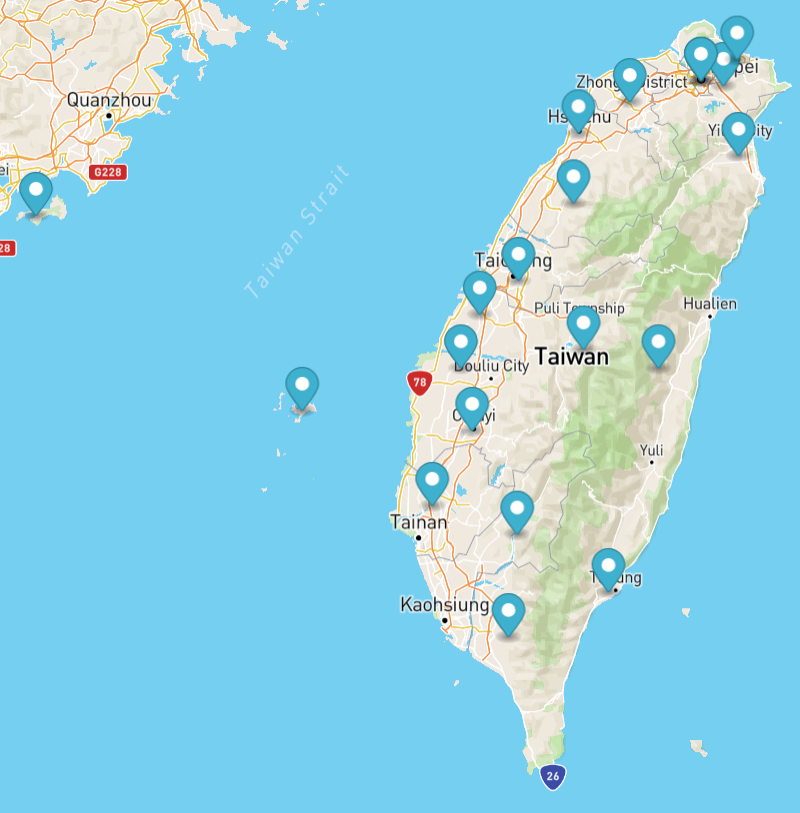
今天來實作一個簡易的台灣天氣地圖
在現代地圖應用中,將實時數據結合地圖顯示是非常常見的功能。在這篇文章中,我們將介紹如何利用 中央氣象局開放資料平台 提供的天氣數據,並結合 Mapbox 來動態顯示台灣各縣市的天氣資訊。
api的部分可以到中央氣象局開放資料平臺去找api key和要取得哪種資料
今天使用的是這筆資料
先看最後成果
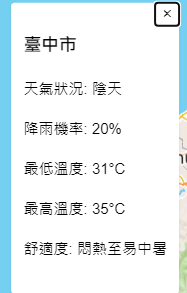
POPUP會顯示該縣市的
Wx:天氣現象(Weather Phenomena),描述如晴天、雨天等天氣狀況。
PoP:降雨機率(Probability of Precipitation),以百分比表示降雨的可能性。
MinT:最低溫度(Minimum Temperature),當日預測的最低氣溫。
CI:舒適度指數(Comfort Index),描述體感舒適度。
MaxT:最高溫度(Maximum Temperature),當日預測的最高氣溫。
fetch('https://opendata.cwa.gov.tw/api/v1/rest/datastore/F-C0032-001?Authorization=開放資料平台的token&limit=22')
    .then(response => response.json())
    .then(data => {
        var locations = data.records.location.map(location => {
            var cityName = location.locationName;
            var weatherElement = location.weatherElement;
            var weatherDescription = weatherElement.find(e => e.elementName === 'Wx').time[0].parameter.parameterName;
            var pop = weatherElement.find(e => e.elementName === 'PoP').time[0].parameter.parameterName + "%";
            var minTemp = weatherElement.find(e => e.elementName === 'MinT').time[0].parameter.parameterName + "°C";
            var maxTemp = weatherElement.find(e => e.elementName === 'MaxT').time[0].parameter.parameterName + "°C";
            var comfortIndex = weatherElement.find(e => e.elementName === 'CI').time[0].parameter.parameterName;

            var coordinates = getCoordinates(cityName);

            return {
                name: cityName,
                coordinates: coordinates,
                weather: {
                    description: weatherDescription,
                    pop: pop,
                    minTemp: minTemp,
                    maxTemp: maxTemp,
                    comfortIndex: comfortIndex
                }
            };
        });

        locations.forEach(function (location) {
            var popup = new mapboxgl.Popup({ offset: 25 })
                .setHTML(`
                    <h3>${location.name}</h3>
                    <p>天氣狀況: ${location.weather.description}</p>
                    <p>降雨機率: ${location.weather.pop}</p>
                    <p>最低溫度: ${location.weather.minTemp}</p>
                    <p>最高溫度: ${location.weather.maxTemp}</p>
                    <p>舒適度: ${location.weather.comfortIndex}</p>
                `);

            new mapboxgl.Marker()
                .setLngLat(location.coordinates)
                .setPopup(popup)
                .addTo(map);
        });
    })
    .catch(error => console.error('Error:', error));
function getCoordinates(cityName) {
    var coordinates = {
        '臺北市': [121.5654, 25.0330],
        '新北市': [121.6739, 25.0135],
        '桃園市': [121.2168, 24.9375],
        '臺中市': [120.6736, 24.1477],
        '臺南市': [120.2513, 23.1417],
        '高雄市': [120.666, 23.0109],
        '基隆市': [121.7419, 25.1276],
        '新竹市': [120.9647, 24.8030],
        '嘉義市': [120.4473, 23.4755],
        '苗栗縣': [120.9417, 24.4893],
        '彰化縣': [120.4818, 23.9929],
        '南投縣': [120.9876, 23.8388],
        '雲林縣': [120.3897, 23.7559],
        '屏東縣': [120.62, 22.5495],
        '宜蘭縣': [121.7469, 24.7021],
        '花蓮縣': [121.3542, 23.7569],
        '臺東縣': [121.1132, 22.7541],
        '金門縣': [118.3171, 24.4327],
        '澎湖縣': [119.6151, 23.5654],
        '連江縣': [119.5397, 26.1974]
    };
    return coordinates[cityName] || [121.5654, 25.0330];
}
