在前幾篇中,我們了解到 Opentelemetry 是如何獲取tracing data、透過開源工具 Jaeger 來可視化,以及手寫了簡單蒐集tracing data的邏輯。接下來我們將進入 Opentelemetry的 metric data。
首先,當然來demo看看在應用中如何透過 Opentelemetry 來獲取 metric data,並且透過另一個開源工具---Prometheus來可視化 metric data。
Prometheus 是CNCF( Cloud Native Computing Foundation )下的一個開源項目,為系統和服務的監控系統。它允許開發者設置不同的監控目標,並定期從這些目標收集指標數據。這些數據可被 Prometheus 存儲、查詢和可視化,並能輕鬆與其他可視化工具如 Grafana 集成。
為了在本地運行 Prometheus,我們需要配置一個 prometheus.yml 文件,這個文件用於定義 Prometheus 應該從哪裡抓取指標數據。每個抓取任務都會定義一個名稱 (例如 nodejs-app),並指定該應用暴露 metric data 的 endpoint。
prometheus.yml
global:
    scrape_interval: 5s # 抓取metric資料間隔

scrape_configs:
    - job_name: 'nodejs-app' # 目標應用名稱
      static_configs:
          # 指定endpoint。因為使用docker
          - targets: ['host.docker.internal:9464']
這裡,我們設置了每 5 秒抓取一次 nodejs-app 的 metrics,該應用暴露 metric data 的端口是 9464。接下來,我們可以使用 Docker Compose 在本地運行 Prometheus。
docker-compose.yml
version: '3'
services:
    self-prometheus-otel:
        image: prom/prometheus:latest
        container_name: self-prometheus-otel
        ports:
            - '9090:9090'
        volumes:
            - ./prometheus.yml:/etc/prometheus/prometheus.yml
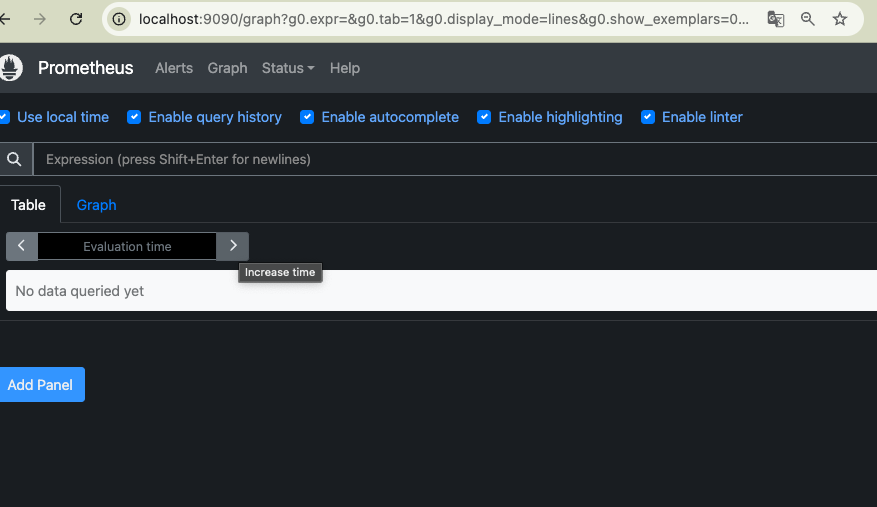
我們將 Prometheus 映射到主機的 9090 端口,這樣我們就可以在 http://localhost:9090上看到 Prometheus 的可視化介面---

我們需要創建一個 otel.js 文件來初始化 OpenTelemetry SDK 並導出指標數據。
otel.js
const { NodeSDK } = require('@opentelemetry/sdk-node');
const {
    getNodeAutoInstrumentations,
} = require('@opentelemetry/auto-instrumentations-node');
const { PrometheusExporter } = require('@opentelemetry/exporter-prometheus');

const prometheusExporter = new PrometheusExporter({ port: 9464 }, () => {
    console.log(
        'prometheus metric data export to http://localhost:9464/metrics',
    );
});

const otelSdk = new NodeSDK({
    metricReader: prometheusExporter,
    instrumentations: [getNodeAutoInstrumentations()],
});

otelSdk.start();
getNodeAutoInstrumentations 會自動為應用啟用多種 Node.js 庫的監控,並通過 PrometheusExporter 將應用程序中的 metric data 導出到 http://localhost:9464/metrics。
接下來,也是只要在根文件中引入:
require('./utils/otel');

const express = require('express');
const cors = require('cors');

const app = express();
const PORT = 3030;
...
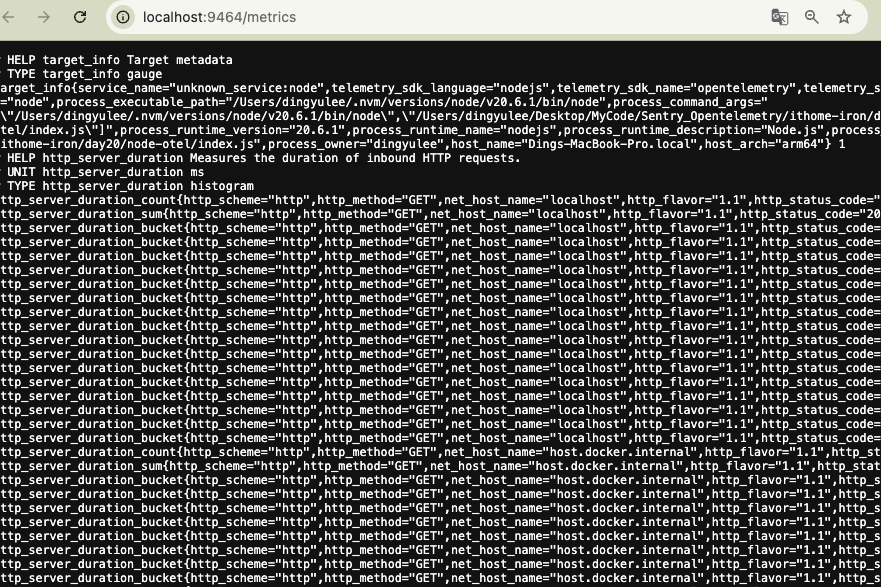
運行後,我們可以在http://localhost:9464/metrics查看是否有metric data:

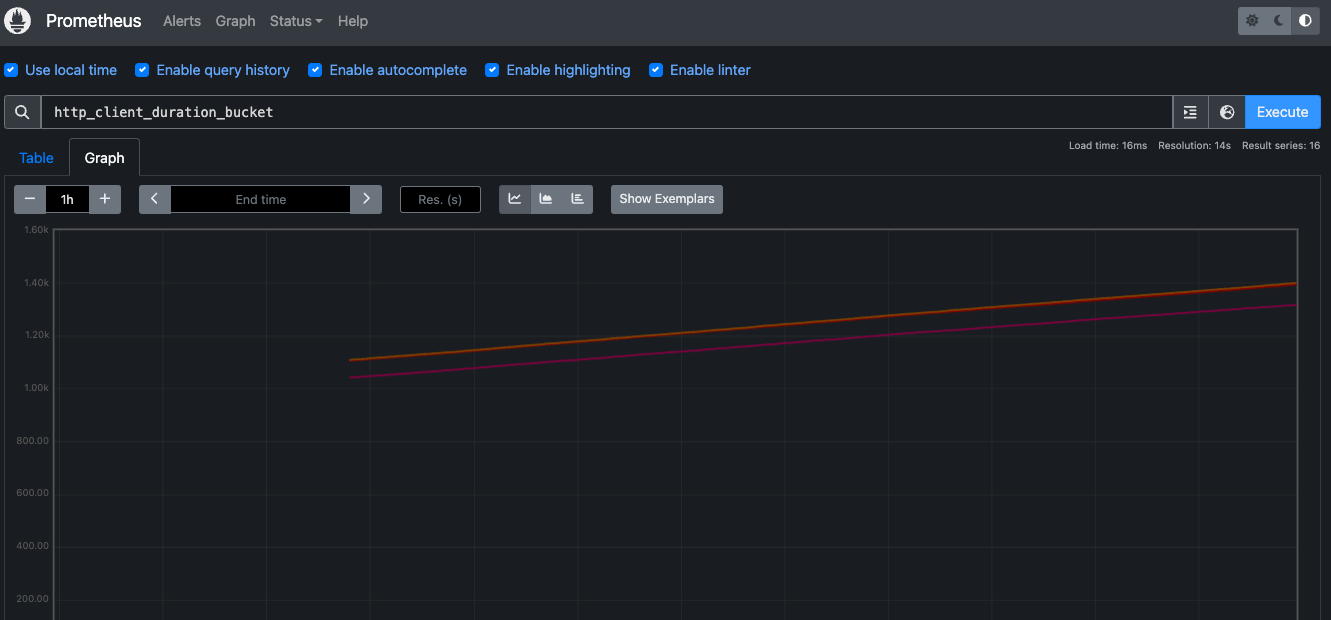
同時,可以進入 Prometheus 的可視化界面中(現在是http://localhost:9090),簡單搜尋一下指標---

看到http_client_duration_bucket這個指標的可視化line chart。
本文我們簡單demo了 NodeJS 應用中,如何設定 Opentelemetry SDK 來蒐集 metric data 、並透過 Prometheus 這個開源監控系統來查看metric data。
