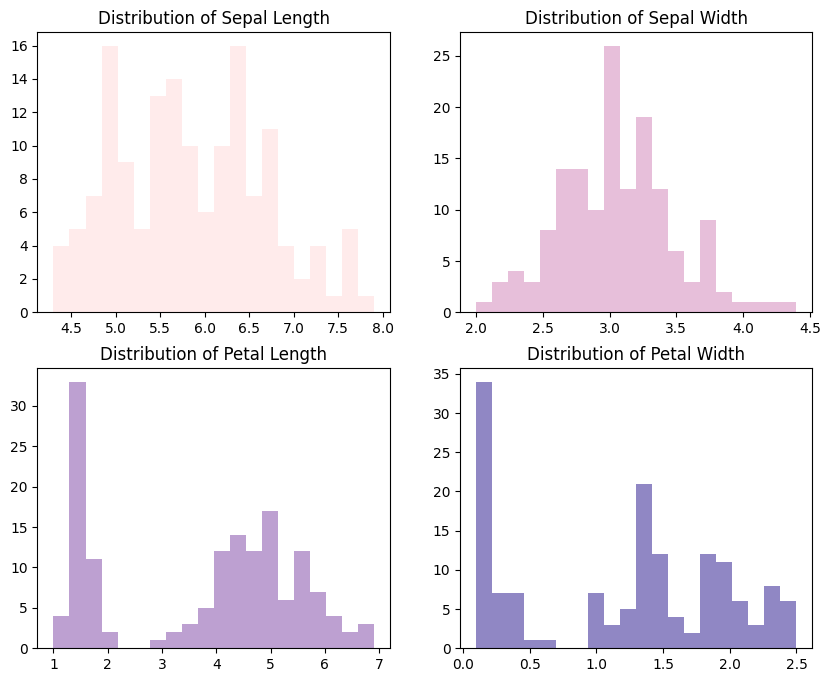
figures = df.columns[:-1] # Predictive variables
palette = ['#FFE6E6', '#E1AFD1', '#AD88C6', '#7469B6'] # purple

fig, ax = plt.subplots(4, 1, figsize=(8, 12))

for i in range(len(figures)):
  ax[i].hist(df[figures[i]], bins=20, color=palette[i], alpha=0.8)
  ax[i].set_xlabel(figures[i].replace('_', ' ').title())

plt.show()
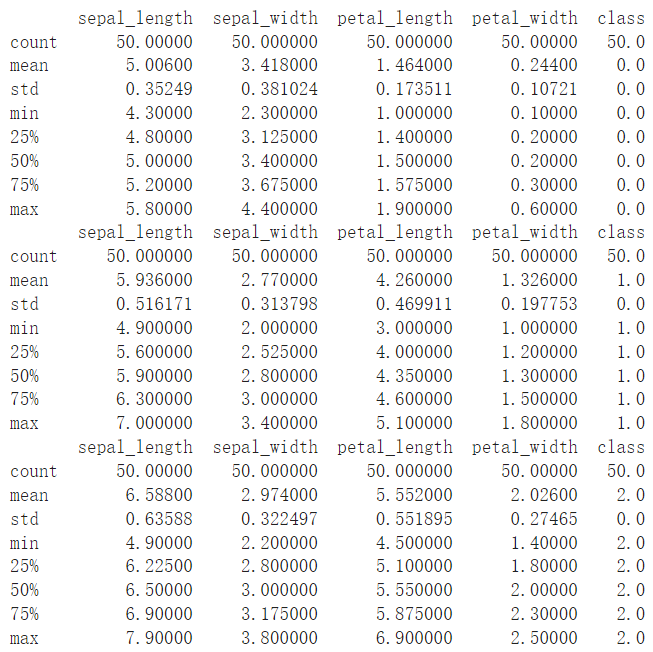
classes = df['class'].unique() # np.array([0, 1, 2])

for c in classes:
  df_tmp = df[df['class'] == c]
  print(df_tmp.describe())
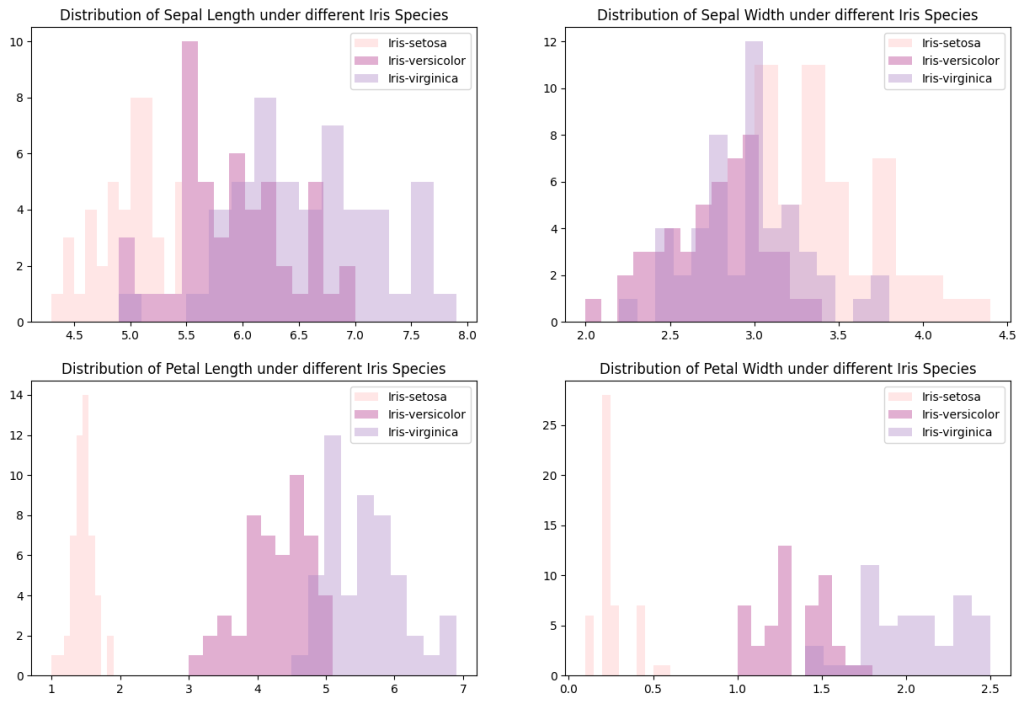
下圖為 3 種鳶尾花類別在各變數下的分布情況。可以看見在變數 Patal Length、Patal Width 下,3 種鳶尾花的分布的中心點,或說是平均數,差距明顯。之後若要對鳶尾花分類,這兩個變數,尤其是 Patal Width 分得很開,是不錯的指標。
fig, ax = plt.subplots(2, 2, figsize=(15, 10))
bins = [15, 15, 10, 10]
alphas = [1., 1., 0.4]

for c in classes:
  print(c)
  df_tmp = df[df['class'] == c]

  counter = 0

  for i in range(int(len(figures) / 2)):
    for j in range(int(len(figures) / 2)):
      ax[i][j].hist(df_tmp[figures[counter]],  \
                bins=bins[counter], color=palette[c], alpha=alphas[c],
                label=class_name[c])
      ax[i][j].set_title('Distribution of ' + \
                figures[counter].replace('_', ' ').title() +
                ' under different Iris Species')

      ax[i][j].legend()
      counter += 1

plt.show()
下圖為各變數在不同花類別下的直方圖,變數 Sepal Length 與 Sepal Width 裡,versicolor 與 virginica 的分布區域較接近。而 Petal Length 與 PSepal Width 裡,versicolor 與 virginica 的分布區域雖有部分重疊,但大致分開。
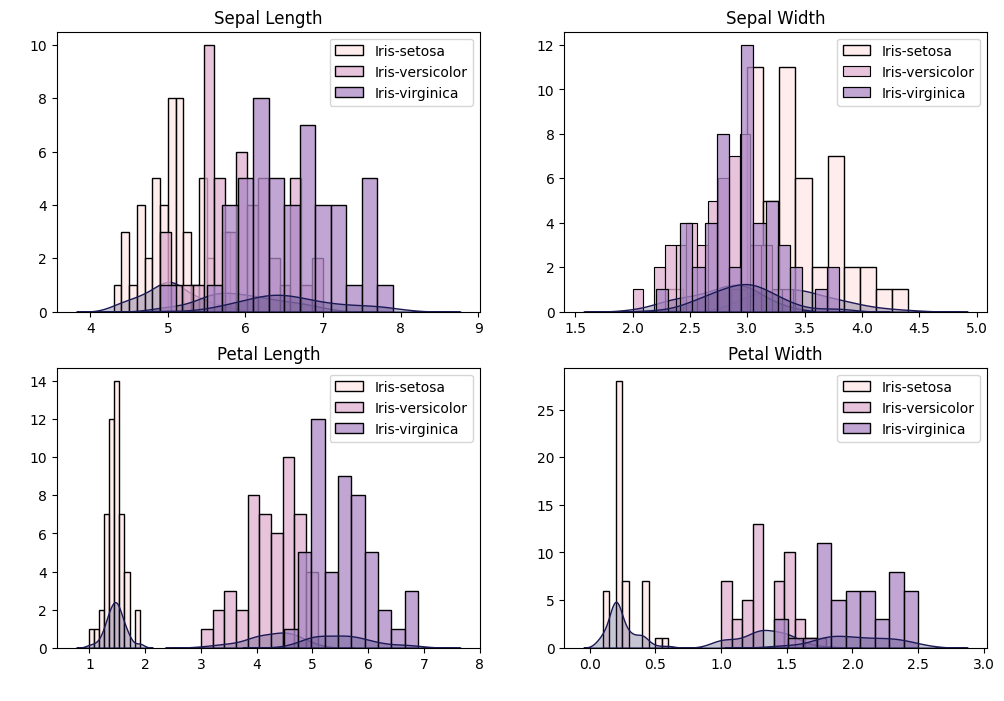
plt.figure(figsize=(12, 8))
n_features = len(df.columns[:-1])
n_rows = n_features // 2 + n_features % 2  # Calculate the number of rows needed

for i in range(len(figures)):
  for c in classes:
    df_tmp = df[df['class'] == c]
    plt.subplot(n_rows, 2, i+1, xlabel=' ')
    sns.histplot(df_tmp[figures[i]], legend=True, \
           bins=bins[i], color=palette[c],
           label=class_name[c])
    sns.kdeplot(df_tmp[figures[i]], color='#1B1A55',\
           fill=True)
    plt.title(figures[i].replace('_', ' ').title())
    plt.ylabel(' ')
    plt.legend()

plt.show()
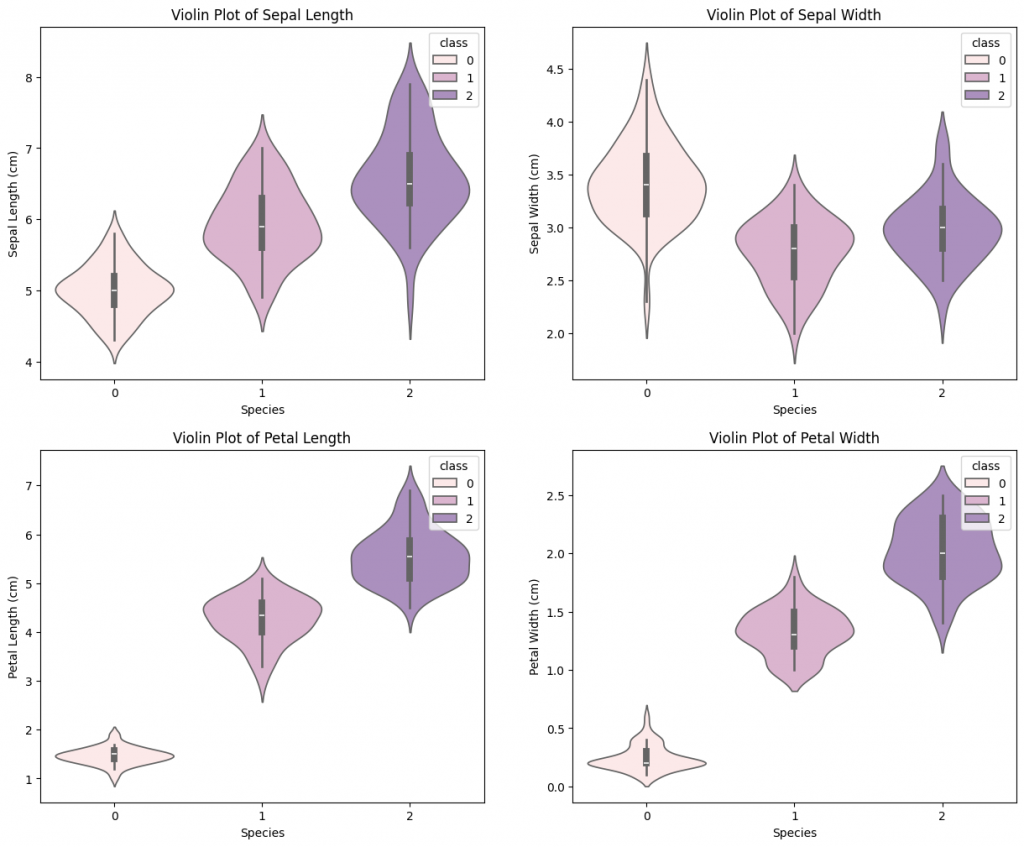
下圖為不同鳶尾花種類下的各變數之小提琴圖,在此想觀察的目標與上圖相同。兩種圖片差異為:直方圖可以呈現分布情況,但不好眼就看出均值、中位數、四分位數的位置;而小提琴可以兼顧這兩種功能,較方便做詳細的分布情況比較。
plt.figure(figsize=(15, 12))

for i in range(len(figures)):

  plt.subplot(2, 2, i+1)
  sns.violinplot(data=df, x='class', y=figures[i], hue='class', palette=palette)
  plt.xlabel('Species', fontsize=10)
  plt.ylabel(r'{} (cm)'.format((figures[i]).replace('_', ' ').title()), fontsize=10)
  plt.title(r'Violin Plot of {}'.format((figures[i]).replace('_', ' ').title()), fontsize=12)

plt.show()
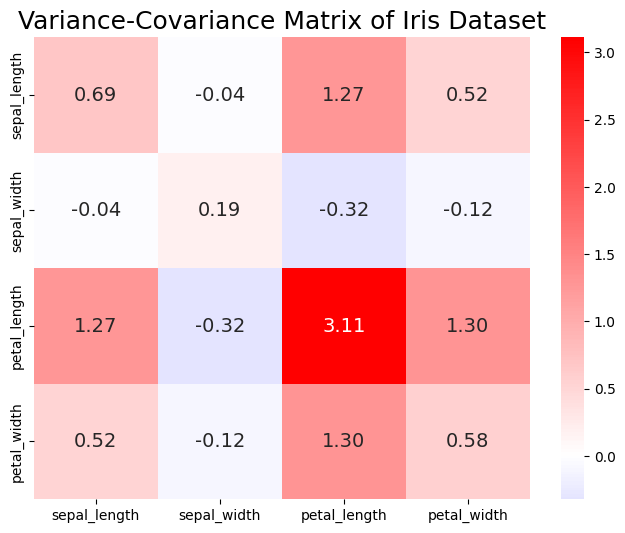
下圖為解釋變數的 Variance-Covariance Matrix,其中變數 Petal Length 的 Variance 較大,而變數 Sepal Width 與自己或其他變數的相關性都不高,尤其是對 Sepal Length 的共變異係數只有 -0.04,相當的低。
# Compute variance-covariance matrix of four predictive variables
Sigma = df.drop('class', axis=1, inplace=False).cov()
print(Sigma)

# Use heatmap to plot the matrix
plt.figure(figsize=(8, 6))

# center: cmap 顏色的中心點
# annot_kws: 調整 annot
sns.heatmap(Sigma, annot=True, fmt=".2f", cmap='bwr',\
      annot_kws={"size":14}, center=0.)

plt.title('Variance-Covariance Matrix of Iris Dataset', fontsize=18)
plt.show()
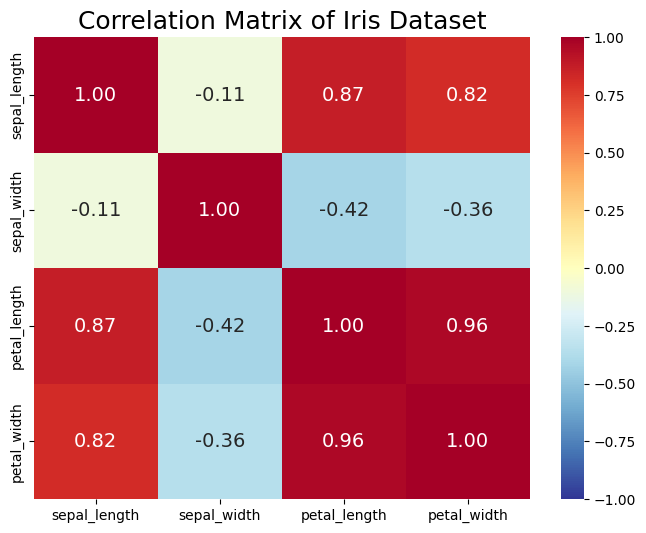
Covariance 與 Correlation 差別在於:前者會受資料變異程度影響數值大小,但後者計算時已除掉資料變異程度。所以 Correlation matrix 較適合用來衡量不同變數之間的相關性,尤其當變數本身分布較廣之時。
下圖為解釋變數的 Correlation Matrix,其中變數 Sepal width 與其他變數不太相關;同時,其他 3 個變數與除 Sepal width 之外都高度正相關。
plt.figure(figsize=(8, 6))

# center: cmap 顏色的中心點
# annot_kws: 調整 annot
sns.heatmap(Corr, annot=True, fmt=".2f", cmap='RdYlBu_r',\
      annot_kws={"size":14}, vmin=-1, vmax=1.)

plt.title('Correlation Matrix of Iris Dataset', fontsize=18)
plt.show()
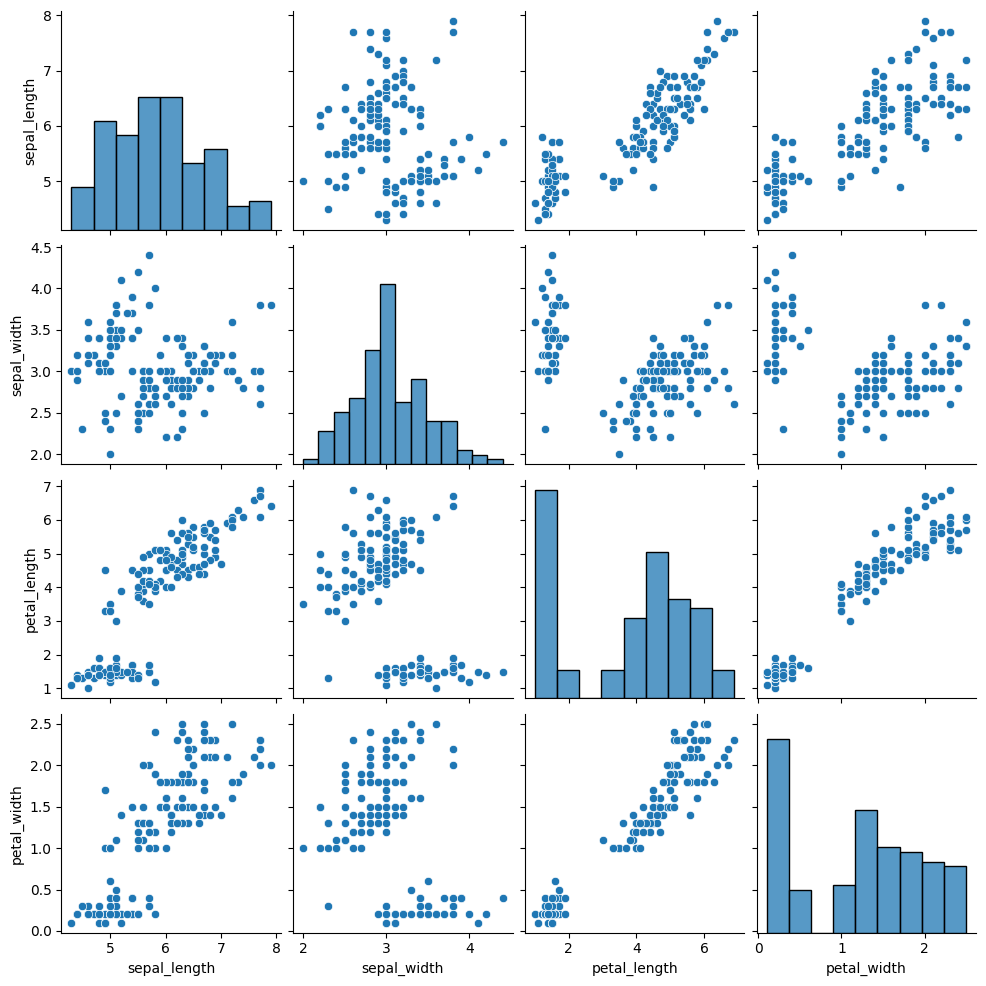
# Create the default pairplot

sns.pairplot(data=df.drop('class', axis=1, inplace=False))
# Create the pairplot with distributions which were highlighted in different species

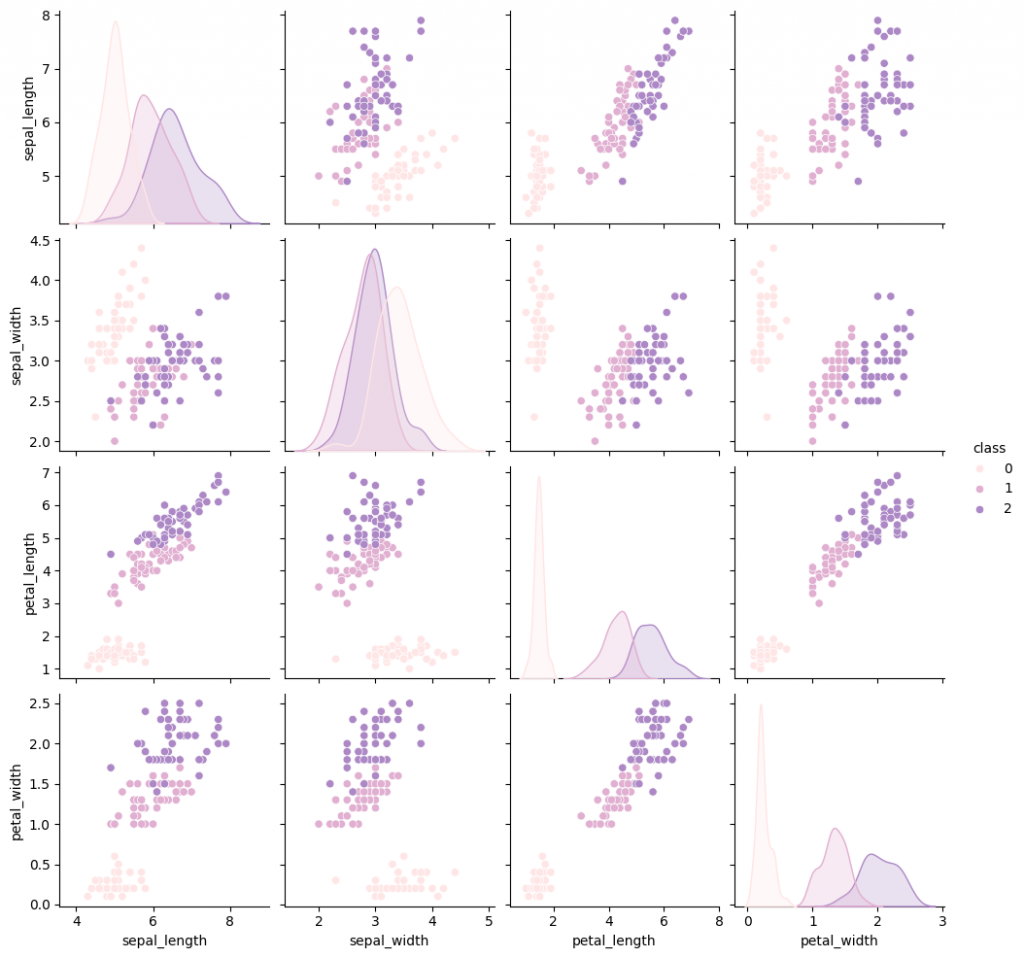
sns.pairplot(data=df, hue='class', palette=palette[:len(classes)])
