import numpy as np
import pandas as pd
import matplotlib.pyplot as plt
import seaborn as sns
import sklearn
import scipy
from IPython.display import Image

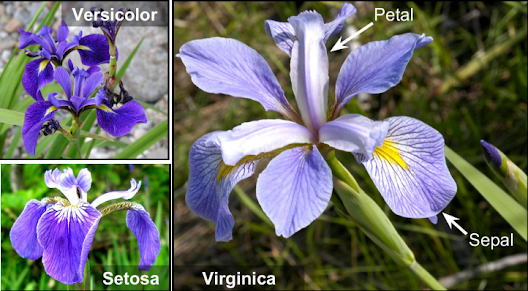
url = 'https://blogger.googleusercontent.com/img/b/R29vZ2xl/AVvXsEimmGMPw0jM_8xjndEHLKj7Hf5fngvWFOJ6_V4jiFb-U0sCHej3aTu08htye1_BgUBGKfnszHoeI_OLLZVf6NjwaG9oDYyOqkjdjeDajd3zg8VuCLVTzDM8hO2XEnarwQeM-CLvFgAwfNX53GR_HPatNPkUH7-7FAoNgFKjw7ujB9LwW5piE8GIPLjJHw/w531-h291/irir_flowers.png'
Image(url=url)
!pip install ucimlrepo
from ucimlrepo import fetch_ucirepo

# fetch dataset
iris = fetch_ucirepo(id=53)

# data (as pandas dataframes)
X = iris.data.features
y = iris.data.targets

df = pd.concat([X, y], axis=1)
df.head()
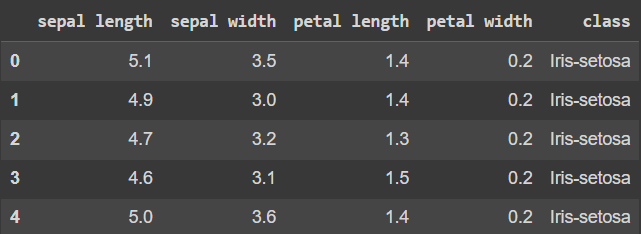
df.shape
(150, 5)
df.nunique()
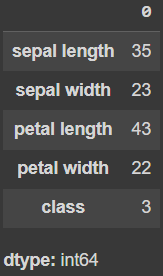
檢查是否有長相一模一樣的資料,發現有 3 筆資料相同。因為筆數不多,決定不對重複的資料處理。
df.duplicated().sum()
檢查是否存有缺師資料,發現並沒有缺失資料,資料完整不須考慮插補。
df.isna().sum()
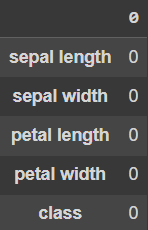
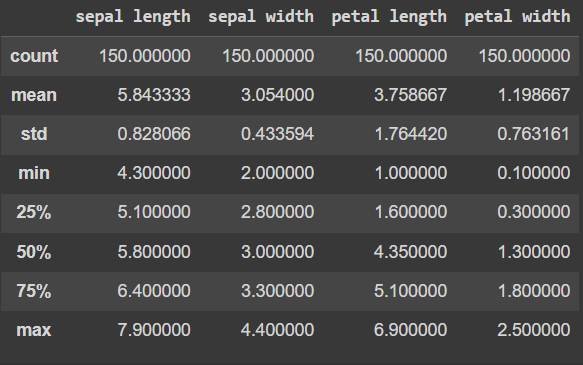
觀察資料的樹續性統計。因 4 種變數的標準差之差距不大,平均數也只差 1 到 2 之間,所以不考慮對資料做標準化。
df.describe()
將資料集的變數名稱做一些改變,把英文字之間的空白替換為下底線。換完後,再檢查一次資料。
df.rename({'sepal length': 'sepal_length',
      'sepal width': 'sepal_width',
      'petal length': 'petal_length',
      'petal width': 'petal_width'}, axis=1, inplace=True)

 df.head()
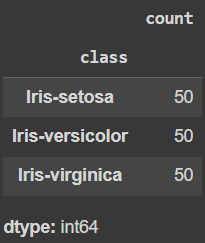
觀察資料裡各鳶尾花有哪一些類別,而各類別佔比幾何。發現 3 種鳶尾花各佔資料集數量的 1/3,即每種鳶尾花各有 50 個樣本。
df['class'].value_counts()
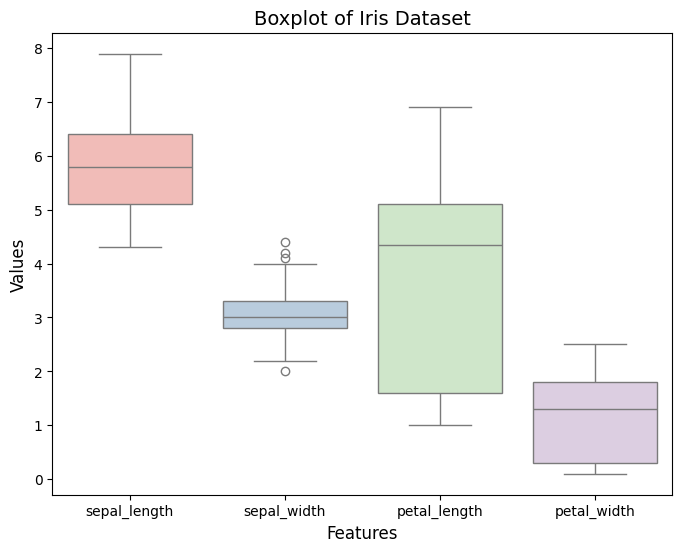
確認資料中是否存有 Outlier
palette = 'Pastel1'

plt.figure(figsize=(8, 6))
sns.boxplot(data=df, palette=palette)
plt.title('Boxplot of Iris Dataset', fontsize=14)
plt.xlabel('Features', fontsize=12)
plt.ylabel('Values', fontsize=12)
plt.show()
Reference:
