昨天(Day 21)我們搭好了微服務王國的「基本建築」:User、Order 兩位要角與資料庫金庫。今天,我們不是再加一棟新樓,而是要安裝「監測系統」——讓整個王國有了監測能力,懂得感受請求壓力、資源異常、服務關係,甚至連 Kubernetes cluster 的心跳都能感知。這正是 OpenTelemetry Collector 的使命!
✅ 理解 OTel Collector 的價值:為什麼需要「中央感知神經」而不是散裝監控
✅ 部署雙重感知系統:應用層 + Kubernetes 集群層的全方位監控
想像你經營一家大型購物中心,你會怎麼監控?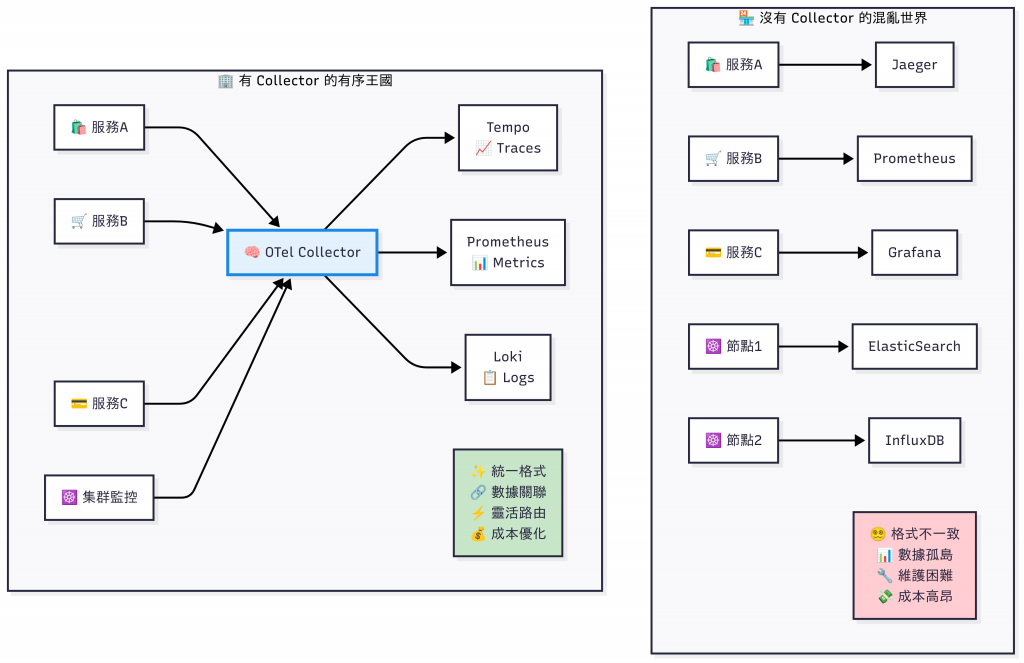
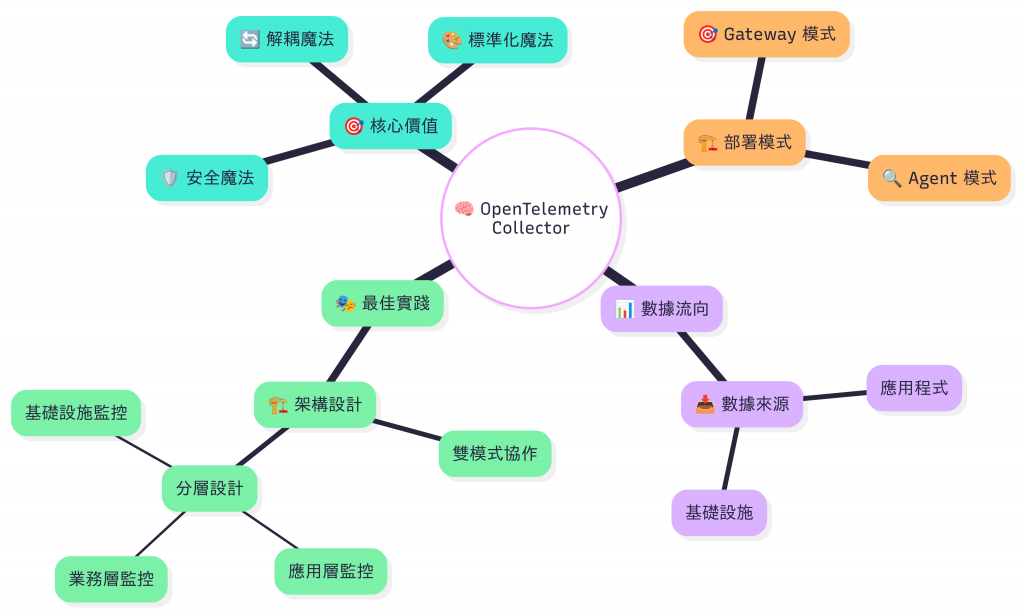
🎭 Collector 的三大魔法
| 魔法類型 | 沒有 Collector | 有 Collector |
|---|---|---|
| 🔄 解耦魔法 | 每個服務直連後端,修改一次全服務重建 | 服務→Collector→任意後端,後端替換不動程式 |
| 🎨 標準化魔法 | 格式、標籤混亂,無法關聯 | 統一 Resource 與 Attributes,完美關聯 |
| 🛡️ 安全魔法 | 難以做抽樣、過濾敏感資料 | Processor 可實施抽樣/遮罩/豐富化 |
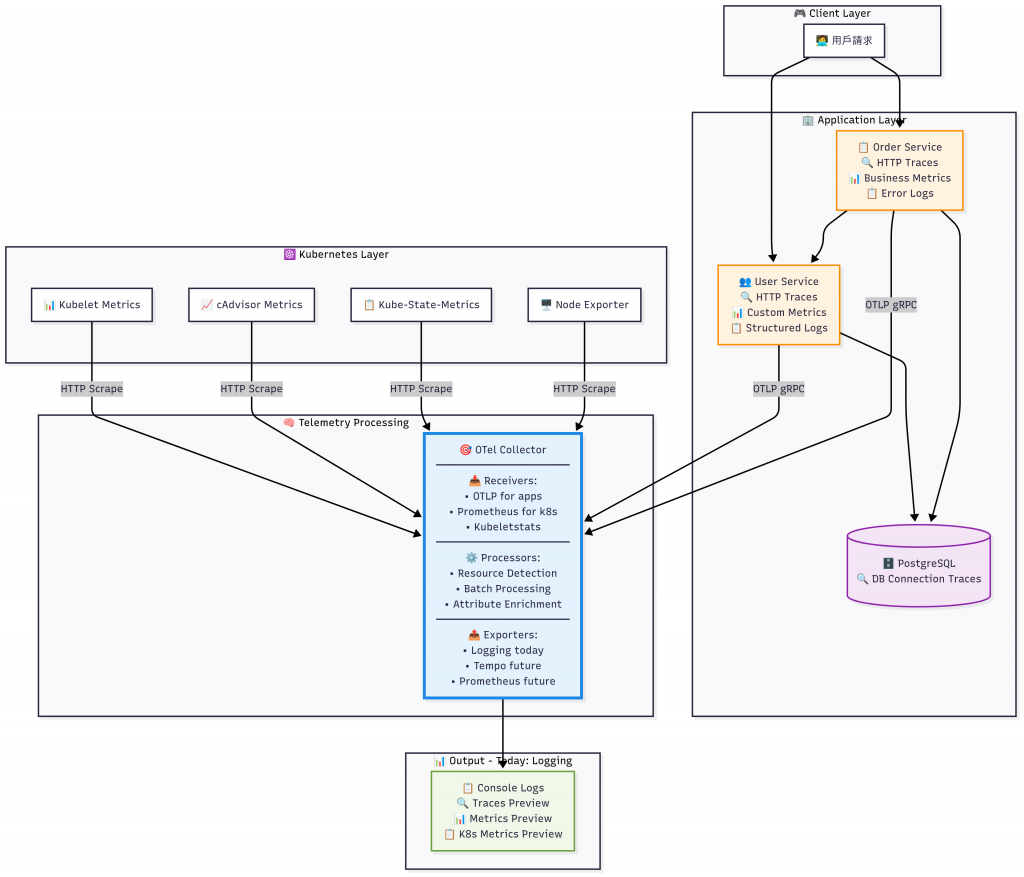
在 Kubernetes 環境中,OTel Collector 有兩種主要的部署模式,每種都有其特定的用途:
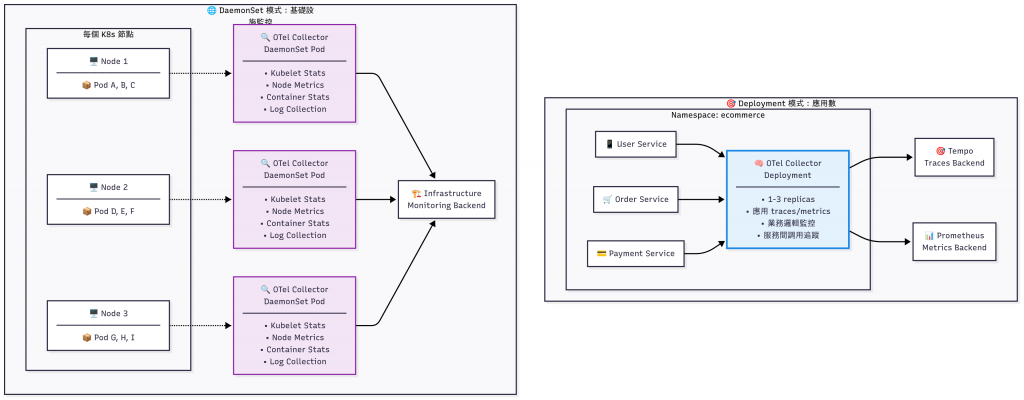
| 特性 | 🎯 Gateway 模式 | 🌐 Agent 模式 |
| 主要用途 | 應用程式遙測資料收集 | 基礎設施監控數據收集 |
| 部署位置 | 特定 Namespace | 每個 K8s 節點 |
| 副本數量 | 1-3 個(可調整) | 每節點 1 個(固定) |
| 資源需求 | 中等(處理應用數據) | 低(本地數據收集) |
| 高可用性 | 支援多副本負載均衡 | 節點級別容錯 |
Gateway 模式 是 OTel Collector 的「中央處理大腦」,專門負責複雜的數據處理和路由:
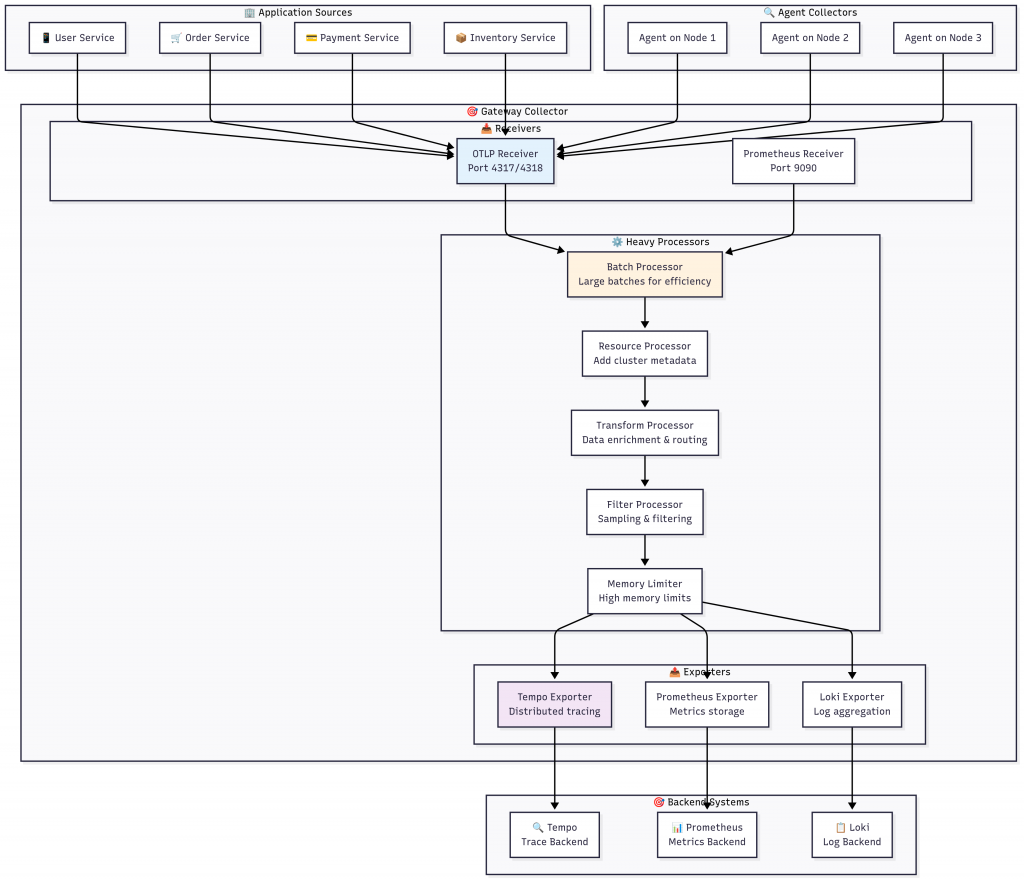
根據 OpenTelemetry 官方文件,Gateway 模式具有以下特點:
✨ 主要優勢
🎯 集中式處理
⚡ 效能最佳化
🛡️ 安全性增強
# Gateway 模式配置 - 重點在於處理能力和路由
receivers:
  # 接收來自應用程式的 OTLP 數據
  otlp:
    protocols:
      grpc:
        endpoint: 0.0.0.0:4317
      http:
        endpoint: 0.0.0.0:4318

  # 接收來自 Agent 的轉發數據
  otlp/agents:
    protocols:
      grpc:
        endpoint: 0.0.0.0:4319

processors:
  # 大批次處理 - Gateway 可以承受更大的批次
  batch:
    timeout: 5s
    send_batch_size: 2048
    send_batch_max_size: 4096

  # 資源豐富化 - 添加集群級別的元數據
  resource:
    attributes:
      - action: insert
        key: k8s.cluster.name
        value: "production-cluster"
      - action: insert
        key: deployment.environment
        value: "production"

  # 複雜的路由邏輯
  routing:
    table:
      - statement: route() where resource.attributes["service.name"] == "user-service"
        pipelines: [traces/user, metrics/user]
      - statement: route() where resource.attributes["service.name"] == "order-service"
        pipelines: [traces/order, metrics/order]

  # 高記憶體限制 - Gateway 通常有更多資源
  memory_limiter:
    limit_percentage: 80
    spike_limit_percentage: 25

exporters:
  # 分散式追蹤後端
  tempo:
    endpoint: tempo:4317
    tls:
      insecure: true

  # 指標後端
  prometheus:
    endpoint: prometheus:9090
    namespace: ecommerce

  # 日誌後端
  loki:
    endpoint: http://loki:3100/loki/api/v1/push

service:
  pipelines:
    traces:
      receivers: [otlp, otlp/agents]
      processors: [memory_limiter, resource, batch, routing]
      exporters: [tempo]

    metrics:
      receivers: [otlp, otlp/agents]
      processors: [memory_limiter, resource, batch]
      exporters: [prometheus]

    logs:
      receivers: [otlp, otlp/agents]
      processors: [memory_limiter, resource, batch]
      exporters: [loki]
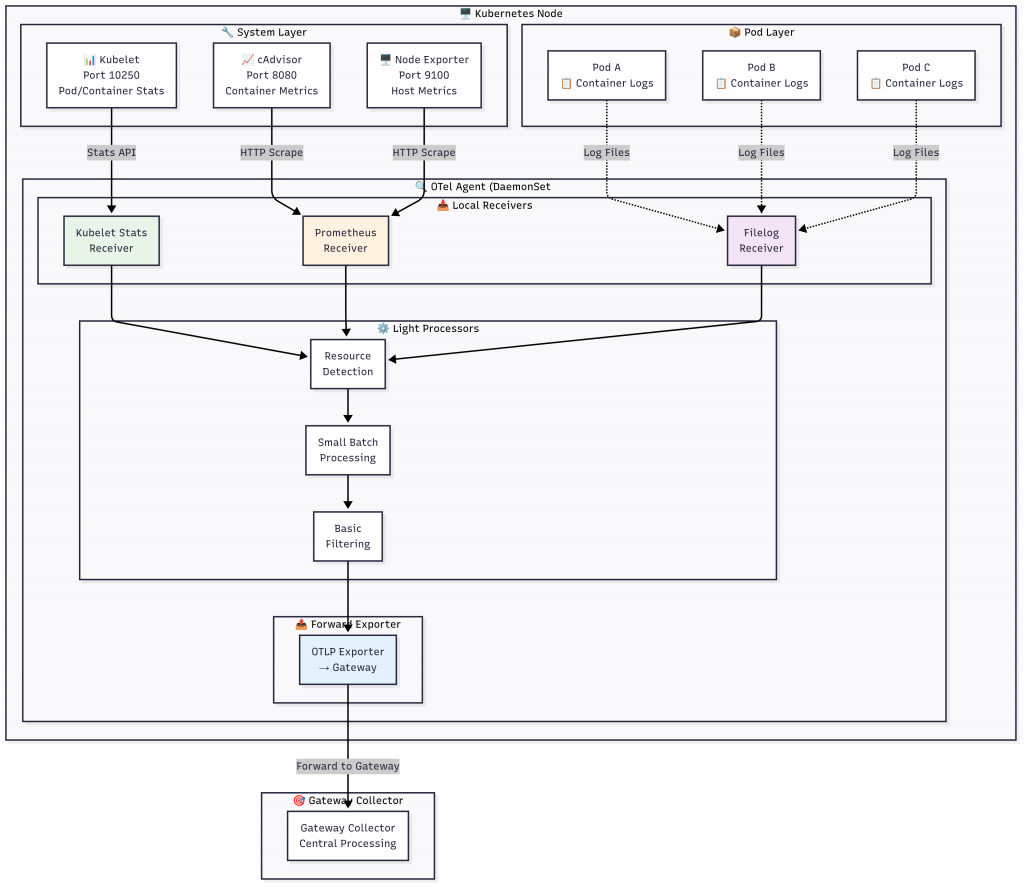
Agent 模式 是部署在每個 Kubernetes 節點上的「感知觸手」,專門負責本地數據的收集:
根據 OpenTelemetry 官方文件,Agent 模式具有以下特點:
✨ 主要優勢
📍 就近收集
💡 資源效率
🔄 容錯能力
# Agent 模式配置 - 重點在於本地收集和輕量處理
receivers:
  # Kubelet 統計接收器 - Agent 模式的核心
  kubeletstats:
    collection_interval: 20s
    auth_type: "serviceAccount"
    endpoint: "https://${env:K8S_NODE_NAME}:10250"
    insecure_skip_verify: true
    metric_groups:
      - node
      - pod
      - container
      - volume

  # 本地 Prometheus 指標收集
  prometheus:
    config:
      global:
        scrape_interval: 30s
      scrape_configs:
        # 本節點的 Node Exporter
        - job_name: 'local-node'
          static_configs:
            - targets: ['localhost:9100']

        # 本節點的 cAdvisor
        - job_name: 'local-cadvisor'
          static_configs:
            - targets: ['localhost:8080']

  # 容器日誌收集
  filelog:
    include:
      - /var/log/pods/*/*/*.log
    exclude:
      - /var/log/pods/*/otlp-*/*.log  # 排除自己的日誌
    operators:
      - type: json_parser
        timestamp:
          parse_from: attributes.time
          layout: '%Y-%m-%dT%H:%M:%S.%fZ'
      - type: move
        from: attributes.log
        to: body

processors:
  # 輕量級記憶體限制
  memory_limiter:
    limit_percentage: 50
    spike_limit_percentage: 10

  # 資源檢測 - 添加節點資訊
  resourcedetection:
    detectors: [env, system, k8snode]
    timeout: 2s

  # 小批次處理 - Agent 使用較小的批次
  batch:
    timeout: 2s
    send_batch_size: 256
    send_batch_max_size: 512

exporters:
  # 轉發到 Gateway Collector
  otlp:
    endpoint: otel-gateway:4319
    tls:
      insecure: true
    sending_queue:
      enabled: true
      num_consumers: 2
      queue_size: 100
    retry_on_failure:
      enabled: true
      initial_interval: 1s
      max_interval: 30s
      max_elapsed_time: 300s

service:
  telemetry:
    logs:
      level: info
    metrics:
      address: 0.0.0.0:8888

  pipelines:
    # 指標管道 - 收集基礎設施指標
    metrics:
      receivers: [kubeletstats, prometheus]
      processors: [memory_limiter, resourcedetection, batch]
      exporters: [otlp]

    # 日誌管道 - 收集容器日誌
    logs:
      receivers: [filelog]
      processors: [memory_limiter, resourcedetection, batch]
      exporters: [otlp]
Gateway 和 Agent 模式的結合創造了一個完美的監控生態系統: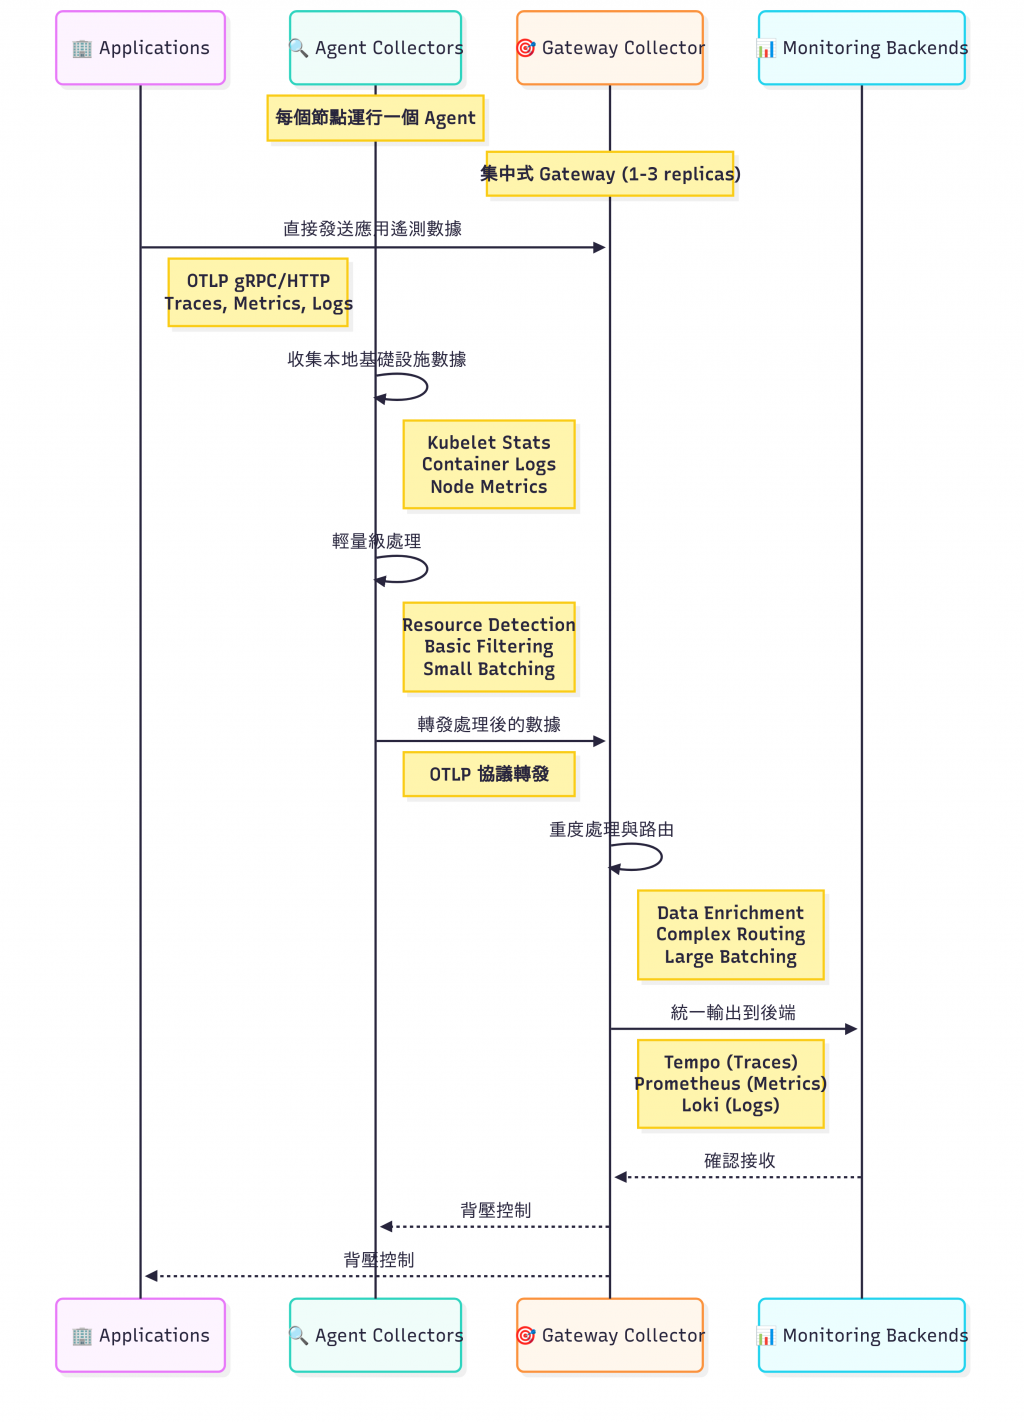
🎯 協作優勢總結
| 協作面向 | 具體優勢 |
|---|---|
| 📊 數據完整性 | Agent 補充基礎設施數據,Gateway 統一收集應用數據,形成完整視圖 |
| ⚡ 效能最佳化 | Agent 就近收集減少延遲,Gateway 批次處理提高效率 |
| 🛡️ 故障隔離 | Agent 故障只影響單節點,Gateway 故障有多副本容錯 |
| 🔄 彈性擴展 | Agent 隨節點自動擴展,Gateway 可根據負載手動擴展 |
| 💰 成本控制 | Agent 輕量化降低節點資源消耗,Gateway 集中處理降低後端壓力 |
🧠 「在可觀測性 Stack 的世界裡,Gateway 是智慧的大腦,Agent 是敏銳的感官。兩者結合,讓我們的系統不僅能『看見』問題,更能『理解』問題的本質,進而『預測』問題的發生。這就是從傳統監控到現代可觀測性的思維躍升。」
通過今天的內容,我們深入理解了 OpenTelemetry Collector 的核心價值和部署策略。你是否發現,這不僅僅是技術工具的選擇,更是一種系統思維的體現?
🧠 架構思維提升
過去我們可能只關注「能不能監控」,現在我們思考「如何穩定監控」
不再是單點解決方案,而是考慮整體系統的韌性和擴展性
分層思考問題的能力
應用層:關注業務邏輯和用戶體驗
基礎設施層:關注資源使用和系統健康
數據處理層:關注效率和可靠性
你是否思考過這些問題:
- 為什麼不直接讓每個應用都連接到監控後端? 🤔
- 在什麼情況下你會選擇只使用 Gateway 模式? 🎯
- 如果 Gateway Collector 掛了,整個監控系統會如何運作? 🛡️