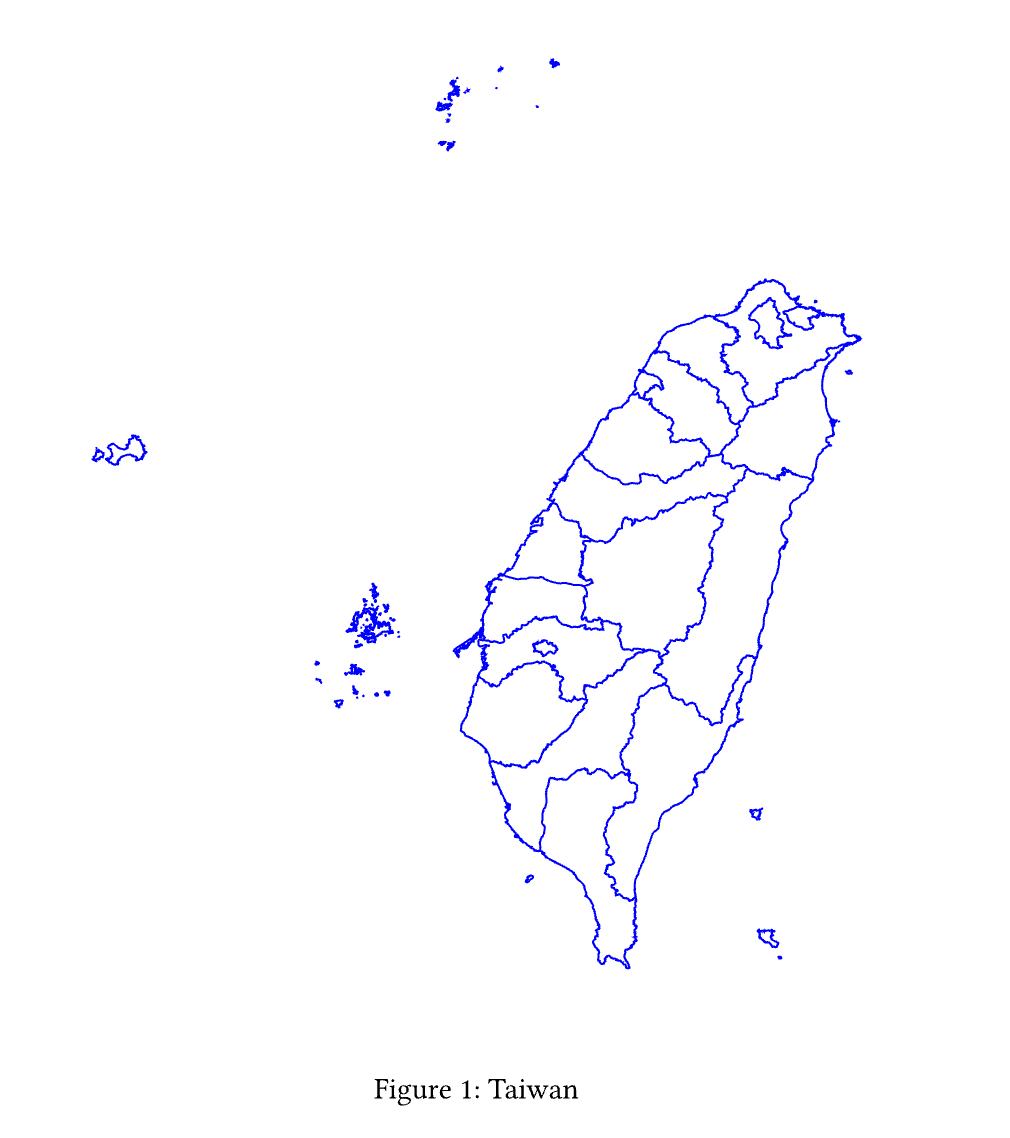
mercator 套件可以輕鬆地把 geojson 檔案內描述的地圖生成對應的 SVG 圖片,並且顯示在 typst 文件中。下面的例子中,我們可以用 g0v 製作的 twgeojson 繪製台灣輪廓。
#show raw.where(lang: "geojson"): it => mercator.render-map(it.text, config)

#let tw = read("twCounty2010.geo.json", encoding: "utf8")
#let config3 = json.encode((
  "stroke": "blue",
  "stroke_width": 0.01,
  "fill": "white",
  "fill_opacity": 0.5,
  show_labels: false))

#figure(render-map(tw, config3, height:400pt), caption: "Taiwan")


 iThome鐵人賽