昨天說要加上刪除功能與血糖圖表,想了想刪除功能應該在 record.html 不應該在 report.html ,所以刪除功能決定改成在填寫表單的最下面加入一個按鈕:清除所有資料,但這部分比較簡單,所以今天目標放在血糖圖表的部分。
<button type="button" id="clearBtn" style="background-color:#d9534f;">
  清除填寫資訊
</button>
if (clearBtn) {
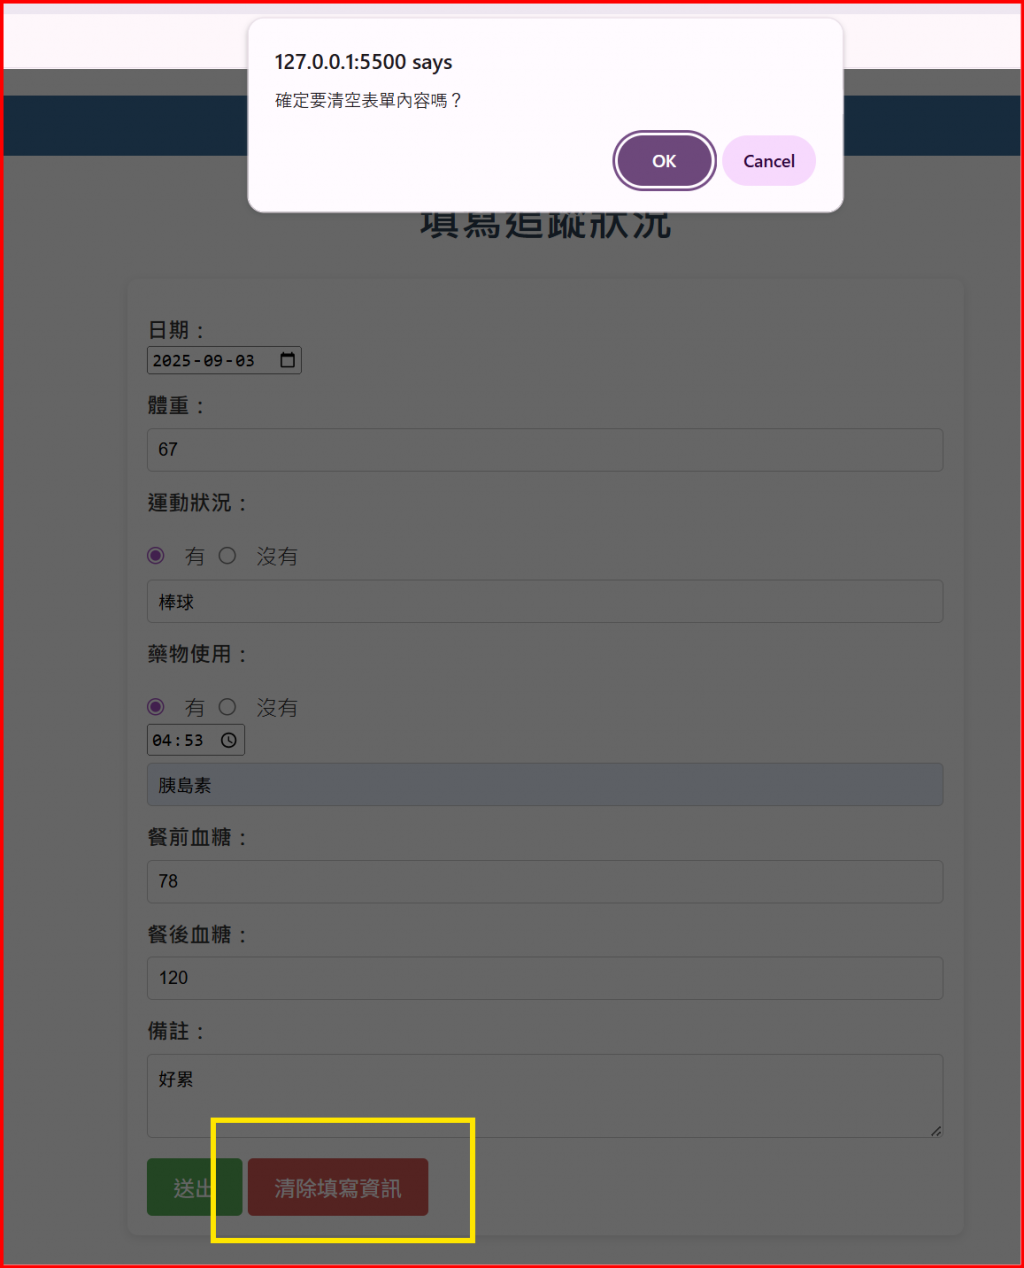
clearBtn.addEventListener("click", function () {
if (confirm("確定要清空表單內容嗎?")) {
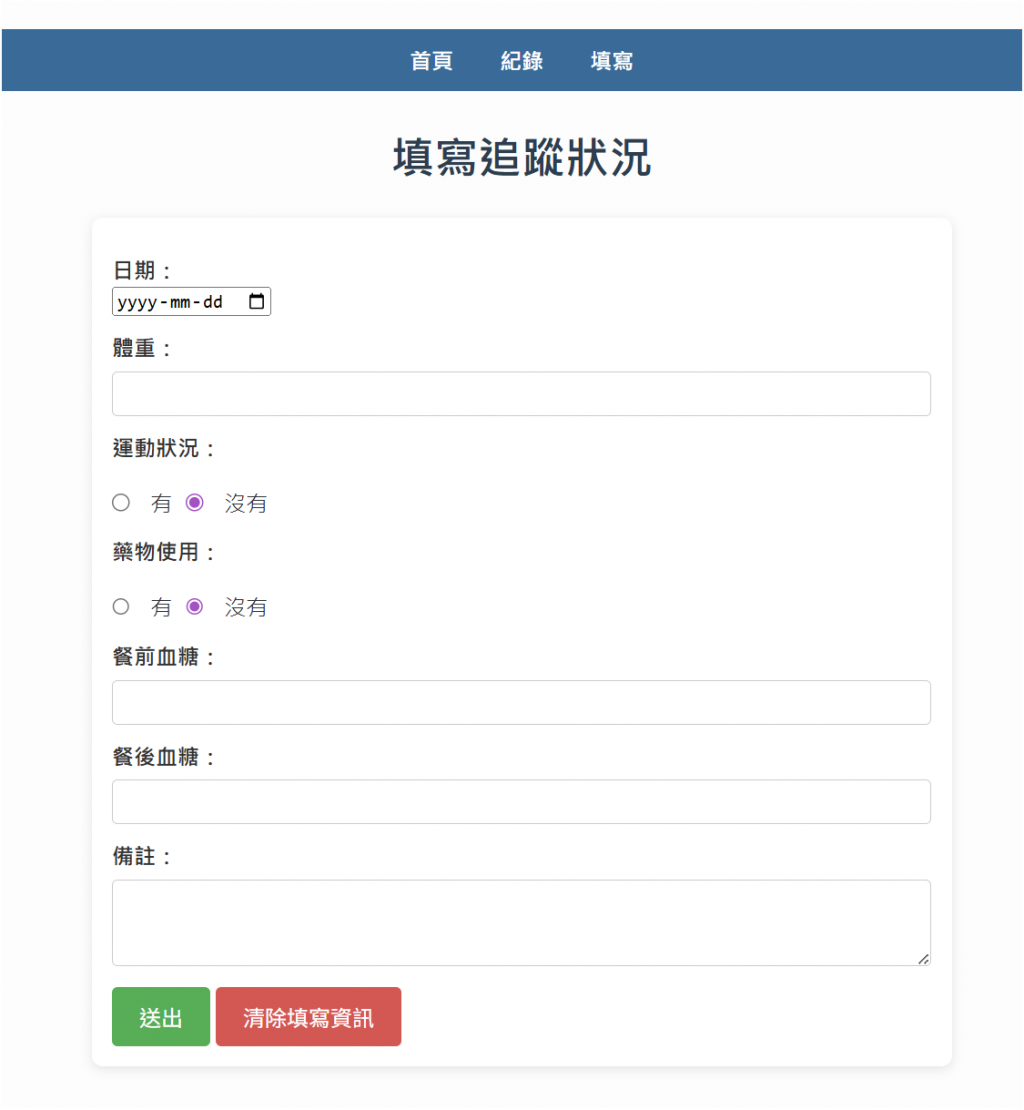
form.reset(); // 清掉所有表單輸入
// 額外:把運動/藥物細節的顯示狀態重設
handleRadioGroupChange(exerciseRadios, exerciseDetail);
const checkedMed = document.querySelector('input[name="medication"]:checked');
toggleMedicationDetail(checkedMed && checkedMed.value === "yes");
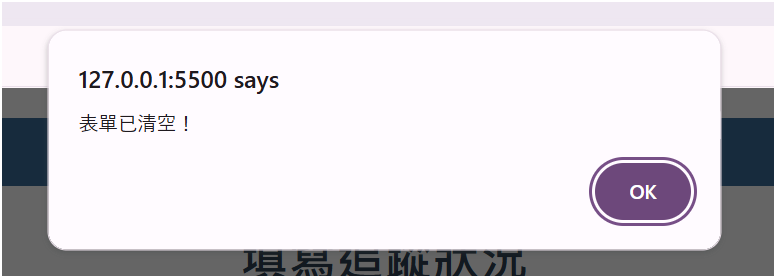
alert("表單已清空!");
}
});
}
這樣就會在最下面看到地個紅色的按鈕,點擊後會刪除上面提好的資訊即可重新填表單。
在HTML加上圖表容器
<div style="width: 80%; margin: 20px auto;">
  <canvas id="glucoseChart"></canvas>
</div>
引入Chart.js
先來了解一下Chart.js :
<canvas> 加上一點JS → 就能畫圖<script src="https://cdn.jsdelivr.net/npm/chart.js"></script>
const ctx = document.getElementById("glucoseChart").getContext("2d");

  const labels = records.map(r => r.date);
  const bfData = records.map(r => r.bf_glucose);
  const afData = records.map(r => r.af_glucose);

  new Chart(ctx, {
    type: "line",
    data: {
      labels: labels,
      datasets: [
        {
          label: "餐前血糖",
          data: bfData,
          borderColor: "blue",
          fill: false,
        },
        {
          label: "餐後血糖",
          data: afData,
          borderColor: "red",
          fill: false,
        },
      ],
    },
    options: {
      responsive: true,
      scales: {
        y: {
          title: {
            display: true,
            text: "血糖值 (mg/dL)"
          }
        },
        x: {
          title: {
            display: true,
            text: "日期"
          }
        }
      }
    }
  });
});
glucoseChart 在 HTML 的位子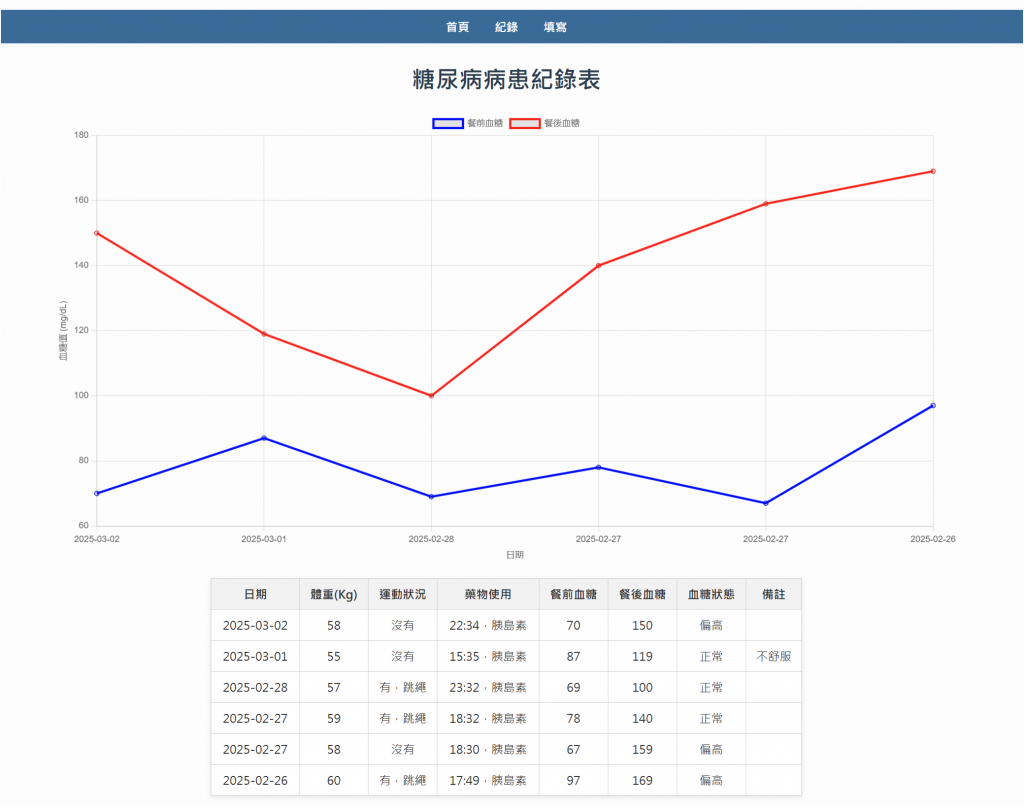


 iThome鐵人賽