apisix服務docker-compose.yaml 檔案內的相關內容 image: "apache/apisix:3.2.2-debian"
volumes:
- ./apisix_config/config.yaml:/usr/local/apisix/conf/config.yaml:ro
ports:
- 9180:9180 # admin api
- 9080:9080 # HTTP
- 9091:9091 # prometheus
- 9443:9443 # HTTPS
- 9092:9092 # control api
- 389:389 # Proxy AD Service
| 設定 | 內容 | 說明 |
|---|---|---|
| image | apache/apisix:3.2.2-debian |
使用apache/apisix:3.2.2-debian作為container的image |
| volumes | ./apisix_config/config.yaml:/usr/local/apisix/conf/config.yaml:ro |
將./apisix_config/config.yaml檔案以唯獨模式掛載到容器內/usr/local/apisix/conf/config.yaml位置 |
| ports | 9080:9080 |
HTTP服務 |
9443:9443 |
HTTPS服務 | |
9180:9180 |
admin API | |
9092:9092 |
control API | |
389:389 |
反向代理LDAP服務 |
後續會再說明admin API。並且有機會的話,會示範一個用APISIX代理LDAP服務的例子。
在目前,只需要知道HTTP服務即可。也就是測試httpbin的APISIX使用的端口9080。像是http://localhost:9080/anything。
再來看看掛載到/usr/local/apisix/conf/config.yaml的./apisix_config/config.yaml內容。
首先看看監聽的端口:
apisix:
  node_listen: 9080              # APISIX listening port
  enable_ipv6: false

  enable_control: true
  control:
    ip: "0.0.0.0"
    port: 9092

  stream_proxy:
    tcp:
    - 389

#### ... more ... #####

plugin_attr:
  prometheus:
    export_addr:
      ip: "0.0.0.0"
      port: 9091
在這邊,首先只有看到9080、9092、389和9091。其中9091的是由外掛prometheus提供。它提供了符合promethues需求的metrics格式,更進一步的會在旁車&APISIX的可觀測性一章提到,此處先帶過。
至於HTTPS的9443其實是預設的HTTPS監聽端口。如果想要變更,可以添加apisix.ssl.listen.port設定路徑,例如:
apisix:
  ssl:
    enable: true
    listen:
      - port: 9443
      - ip: 127.0.0.3
        port: 9445
然後來看看deployment.etcd部分,這部分應該不必多說,就是設定etcd連線位置http://etcd:2379:
deployment:
  etcd:
    host:                           # it's possible to define multiple etcd hosts addresses of the same etcd cluster.
      # multiple etcd address
      - http://etcd:2379
    prefix: "/apisix"               # apisix configurations prefix
    timeout: 30                     # 30 seconds
相對來說deployment.admin更爲重要:
deployment:
  admin:
    allow_admin:               # https://nginx.org/en/docs/http/ngx_http_access_module.html#allow
      - 0.0.0.0/0              # We need to restrict ip access rules for security. 0.0.0.0/0 is for test.

    admin_key:
      - name: "admin"
        key: SaiTJp7TEa9K39oy7D5A4ouXmdqHvL9a
        role: admin                 # admin: manage all configuration data
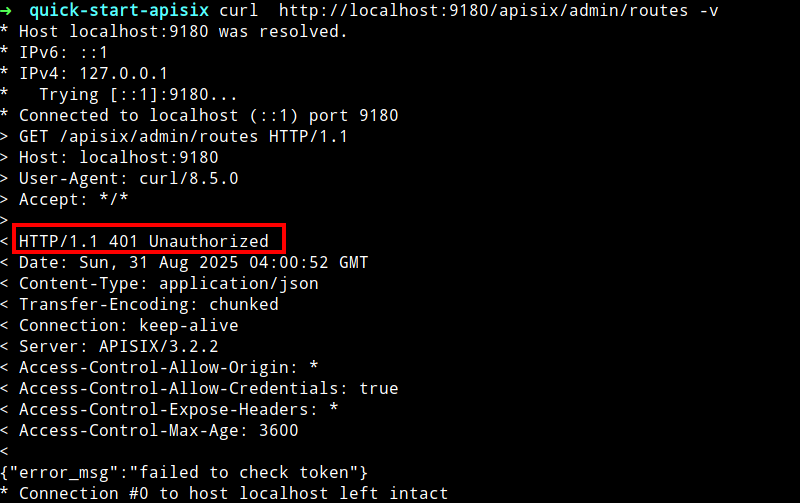
其中admin.admin_key是用於admin API的密鑰。像是直接取得路由資訊的API是 /apisix/admin/routes,但會發現是禁止存取的,收到401未授權的訊息:
curl http://localhost:9180/apisix/admin/routes -v
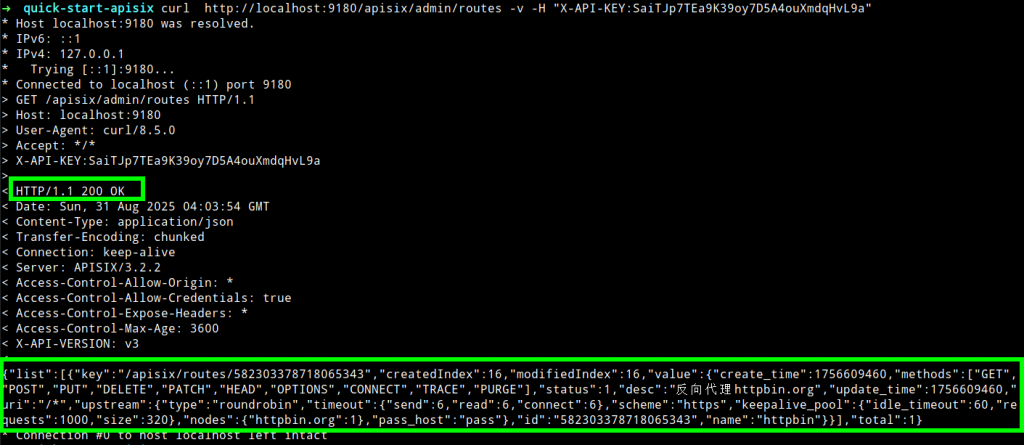
必須要將請求標頭加上X-API-KEY: SaiTJp7TEa9K39oy7D5A4ouXmdqHvL9a
dashboard服務Dashboard直接來看掛在到/usr/local/apisix-dashboard/conf/conf.yaml的啓動檔案./apisix_dashboard_config/config.yaml:
conf:
  listen:
    # host: 0.0.0.0     # `manager api` listening ip or host name
    port: 9000          # `manager api` listening port
  etcd:
    endpoints:          # supports defining multiple etcd host addresses for an etcd cluster
      - "http://etcd:2379"
    prefix: /apisix     # apisix config's prefix in etcd, /apisix by default
authentication:
    - username: admin   # username and password for login `manager api`
      password: admin
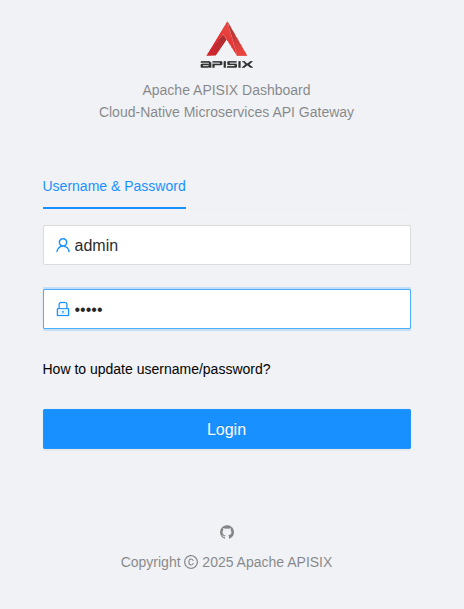
其中最重要的是authentication,這也是我們在使用Dashboard登入的帳號和密碼。
來看看最主要的內容:匹配規則和上游設定:
{
  "uri": "/*",
  "upstream": {
    "nodes": [
      {
        "host": "httpbin.org",
        "port": 443,
        "weight": 1
      }
    ],
    "scheme": "https"
}
當請求符合"uri": "/*"規則時,將請求轉發到上游。
這個設定是/*,意味者請求只要是/開頭就符合。因此,GET /image是符合的,這時候就會將請求帶到上游-https://httpbin.org:443