
Go 提供了性能剖析工具 pprof,這是個在遇到性能瓶頸時非常有用的開發者工具。
pprof 有兩種形式:
pprof.StartCPUProfile(*os.File) 與 pprof.StopCPUProfile()
http.(*Server) 初始化時 import _ "net/http/pprof",它會註冊一個路由專門用於性能剖析對於大多數的常駐型應用程式(例如伺服器),使用 "net/http/pprof" 會是比較方便的選擇。
我們的服務是一個 RESP Server,並沒有 HTTP Server,因此需要在 main.(*App) 中加入一個 HTTP Server
// file: cmd/olivine/app.go
type App struct {
	cfg *data.Config

	worker  service.Worker
	server  server.Server
+	httpsrv *http.Server
}
然後用一個 goroutine 來啟用 Web Server,並且加入 Graceful Shutdown 的機制:
// file: cmd/olivine/app.go
g.Go(func() error {
	slog.Info("starting web server")
	if err := app.httpsrv.ListenAndServe(); err != nil && !errors.Is(err, http.ErrServerClosed) {
		return err
	}
	return nil
})

// ...

if err := httpsrv.Shutdown(shutdownCtx); err != nil {
	return err
}
在 kessoku 中在 localhost:6060 註冊
// file: ./cmd/olivine/kessoku.go
httpsrv: &http.Server{
	Addr: "localhost:6060",
}
註1:profiling server 絕對不可以讓外部存取,其中會包含很多除錯資訊(包括原始碼),因此這邊使用
localhost:6060讓 http server 只對本機提供服務。
註2:
"net/http/pprof"使用func init()來註冊相關路由,它會自動提供/debug/pprof/*相關的路由
為了剖析服務的性能,我們可以使用由 Redis 自帶的 redis-benchmark。以下是它的一些用法範例:
$ redis-benchmark -t GET,SET # 只測試 GET/SET 指令
$ redis-benchmark -n 1000000 # 所有請求加起來僅有 100 萬次
$ redis-benchmark -c 500     # 建立 500 個平行客戶端,它們會同步發送指令
$ redis-benchmark -P 16      # 對於一條 TCP 連線,它們會用 Redis Pipeline 一次發送 16 條指令
它會生成如下的報告:
$ redis-benchmark -p 16379 -t GET
WARNING: Could not fetch server CONFIG
====== GET ======
  100000 requests completed in 1.00 seconds
  50 parallel clients
  3 bytes payload
  keep alive: 1
  multi-thread: no

Latency by percentile distribution:
0.000% <= 0.039 milliseconds (cumulative count 2)
50.000% <= 0.263 milliseconds (cumulative count 51164)
75.000% <= 0.279 milliseconds (cumulative count 76752)
87.500% <= 0.295 milliseconds (cumulative count 88450)
93.750% <= 0.319 milliseconds (cumulative count 94498)
96.875% <= 0.351 milliseconds (cumulative count 96963)
98.438% <= 0.455 milliseconds (cumulative count 98444)
99.219% <= 1.167 milliseconds (cumulative count 99221)
99.609% <= 1.759 milliseconds (cumulative count 99612)
99.805% <= 1.895 milliseconds (cumulative count 99805)
99.902% <= 1.959 milliseconds (cumulative count 99911)
99.951% <= 2.039 milliseconds (cumulative count 99957)
99.976% <= 2.063 milliseconds (cumulative count 99978)
99.988% <= 2.087 milliseconds (cumulative count 99988)
99.994% <= 2.127 milliseconds (cumulative count 99994)
99.997% <= 2.183 milliseconds (cumulative count 99997)
99.998% <= 2.367 milliseconds (cumulative count 99999)
99.999% <= 2.415 milliseconds (cumulative count 100000)
100.000% <= 2.415 milliseconds (cumulative count 100000)

Cumulative distribution of latencies:
0.060% <= 0.103 milliseconds (cumulative count 60)
1.352% <= 0.207 milliseconds (cumulative count 1352)
91.288% <= 0.303 milliseconds (cumulative count 91288)
98.120% <= 0.407 milliseconds (cumulative count 98120)
98.586% <= 0.503 milliseconds (cumulative count 98586)
98.848% <= 0.607 milliseconds (cumulative count 98848)
99.020% <= 0.703 milliseconds (cumulative count 99020)
99.121% <= 0.807 milliseconds (cumulative count 99121)
99.161% <= 0.903 milliseconds (cumulative count 99161)
99.181% <= 1.007 milliseconds (cumulative count 99181)
99.200% <= 1.103 milliseconds (cumulative count 99200)
99.248% <= 1.207 milliseconds (cumulative count 99248)
99.324% <= 1.303 milliseconds (cumulative count 99324)
99.368% <= 1.407 milliseconds (cumulative count 99368)
99.402% <= 1.503 milliseconds (cumulative count 99402)
99.430% <= 1.607 milliseconds (cumulative count 99430)
99.506% <= 1.703 milliseconds (cumulative count 99506)
99.688% <= 1.807 milliseconds (cumulative count 99688)
99.816% <= 1.903 milliseconds (cumulative count 99816)
99.934% <= 2.007 milliseconds (cumulative count 99934)
99.992% <= 2.103 milliseconds (cumulative count 99992)
100.000% <= 3.103 milliseconds (cumulative count 100000)

Summary:
  throughput summary: 99601.60 requests per second
  latency summary (msec):
          avg       min       p50       p95       p99       max
        0.280     0.032     0.263     0.327     0.695     2.415
我們想要在執行 redis-benchmark 的時候進行性能剖析。(可以使用 -n 10000000 來避免 benchmark 太快結束):
$ redis-benchmark -p 16379 -t SET -P 16 -n 1000000000
然後用瀏覽器或 HTTP 工具存取 GET http://localhost:6060/debug/pprof/profile 就可以取得報告,它預設會收集 30 秒的資訊。
然後可以使用 go tool pprof 來分析它:
$ curl -o profile http://localhost:6060/debug/pprof/profile
$ go tool pprof -http=:8000 profile
接著,pprof 工具可以建立一個火焰圖:
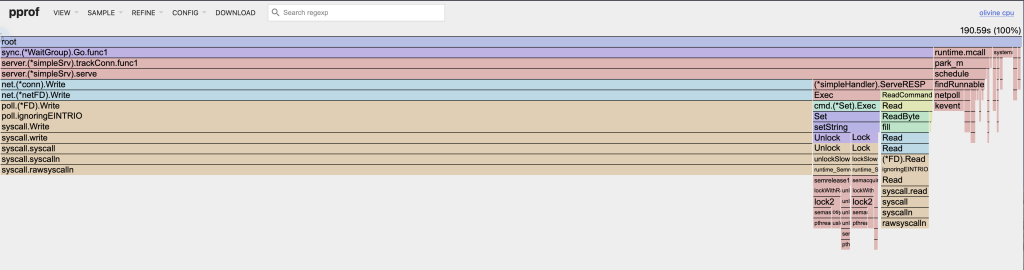
很顯然地,目前的伺服器會花費 80% 的 CPU 時間在 conn.Write() 上,這是不可接受的。
我們可以點選火焰圖上的 server.(*simpleSrv).serve 鎖定它,然後再點擊上方導覽列的 "View" -> "Source",可以看到原始碼層級的分析:
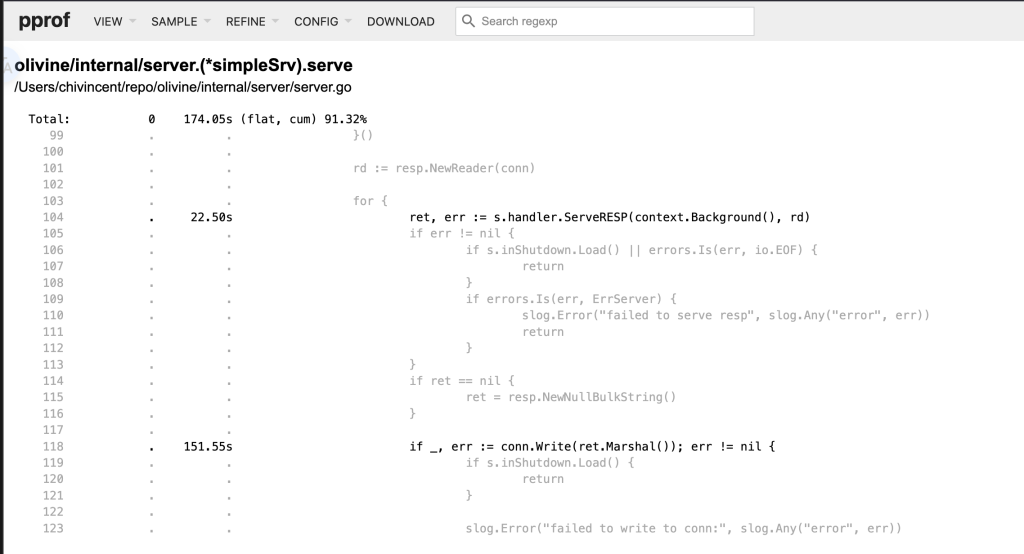
我們不難注意到 conn.Write(ret.Marshal()) 花費了 151.55 秒,這代表在 conn.Write() 的時候浪費了很多時間在系統呼叫;我們可以用 Buffered Writer 來取代:
// file: internal/server/server.go
func (s *simpleSrv) serve(conn net.Conn) {
	defer conn.Close()
	defer func() {
		s.mu.Lock()
		defer s.mu.Unlock()

		delete(s.conns, conn)
	}()

	rd := resp.NewReader(conn)
+	wr := bufio.NewWriter(conn)
+	defer wr.Flush()

	for {
		// ...
	}
當 resp.(*Reader) 沒有輸入之後,就把 buffered writer 中的資料寫回 conn:
// file: ./pkg/resp/io.go
func (r *Reader) Buffered() int { return r.rd.Buffered() }
// file: ./internal/server/server.go
	if rd.Buffered() == 0 {
		if err := wr.Flush(); err != nil {
			if s.inShutdown.Load() {
				return
			}

			slog.Error("failed to flush", slog.Any("error", err))
			return
		}
	}
再重新跑一次 benchmark,並且觀察 profiling 的火焰圖:
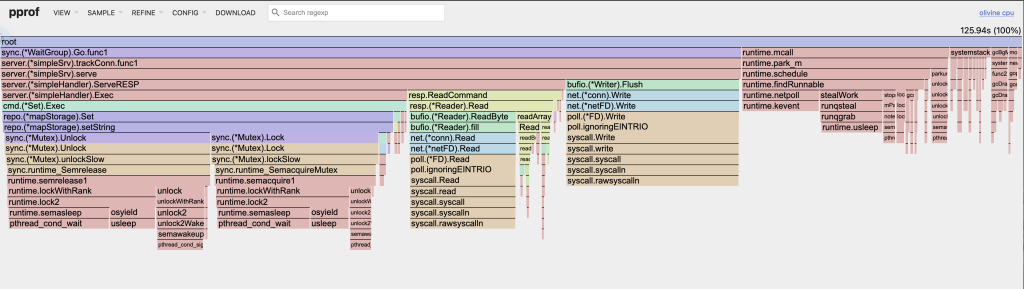
可以看到 net.(*conn).Write 的 CPU 耗時從 151.53 秒降到 21.37 秒,這是一個巨大進步
為了簡化「啟動服務 -> 跑 benchmarking -> 跑 profiling」的流程,我寫了一個簡單的 shell script 來做
https://github.com/jr-dragon/olivine/blob/6059bae8895fe0e276a85bc31e70f9e8e0e715f7/scripts/pprof.sh



 iThome鐵人賽
 看影片追技術