
資料工程裡很常見的模式是:大量 event、order 或 impression records,要依一張較小的產品、使用者或規則表補上欄位。程式看起來只是一個 join,但 Spark 可能選擇把小表送到每個 Executor,也可能要求兩張表都依 join key 重新分配。這個選擇會改變 Stage 數、task 數與 shuffle 資料量。
Ep23 剛讓我看到 key 集中會讓單一 task 拖住 Stage;這次先將 key 分布保持均勻,只看 join strategy 本身。我要回答的是:physical plan 中的 BroadcastHashJoin 和 SortMergeJoin 分別代表什麼資料移動?又該如何從 Spark UI 驗證?
BroadcastHashJoin 與 SortMergeJoin 在資料移動上的根本差異。explain()、SQL / DataFrame、Job DAG 與 Stage metrics 找出 join strategy。count() 仍可能留下小型 shuffle,卻不代表 join 本身走 shuffle join。SortMergeJoin 時,接下來該檢查哪些條件。Ep22:Jobs → Stages → Tasks → Executors
先建立 Spark UI 的診斷順序
↓
Ep23:data skew
key 集中如何讓一個 task 成為 straggler
↓
Ep24:join strategy
BroadcastHashJoin 或 SortMergeJoin 如何決定資料要不要 shuffle
↓
Ep25:小檔案
scan task 為什麼可能多到讓排程成本主導
這篇只比較兩種最常在 Spark UI 與 physical plan 中遇到的 equi-join 策略。它不會提供一組通用門檻,也不會提前把 AQE、skew join 或 salting 混進來。
這次有一張 1,000,000-row 的 fact table,和一張 2,000-row 的 dimension table,兩者用均勻分布的 product_id 做 inner join。兩個 phase 的資料、join key、Executors 與 action 都相同;唯一改變的是 Spark 使用的 join strategy。
BroadcastHashJoin

small dimension table
    ↓ broadcast 到每個 Executor
各 partition 的 fact rows ──── local lookup ──── join result

SortMergeJoin

fact rows ────── Exchange(product_id) ── Sort ──┐
                                                 ├── join result
dimension rows ─ Exchange(product_id) ── Sort ──┘
BroadcastHashJoin 將小的一側製成可查找的 relation,傳給執行 fact-side tasks 的 Executors;大型 fact table 不必為了 join key 重分配。SortMergeJoin 則要求兩側都依 join key 的 hash partitioning 重分配,並排序後合併。後者能處理兩張都無法安全 broadcast 的大表,但 shuffle 是明確成本。
join 的關鍵不是 API 只有一行,而是 Spark 為了讓兩側的 key 能相遇,選擇了哪一條資料移動路徑。
實驗用 spark.range 生成兩張表,避免 input file、cache 或 Python UDF 混進比較。fact table 的每個 product_id 都能在 dimension table 找到對應列,因此兩個 phase 的結果都應是 1,000,000 rows。
fact = spark.range(1_000_000, numPartitions=8).select(
    (F.col("id") % F.lit(2_000)).cast("int").alias("product_id"),
    (F.col("id") % F.lit(97)).cast("int").alias("event_value"),
)
dimension = spark.range(2_000, numPartitions=8).select(
    F.col("id").cast("int").alias("product_id"),
    F.when(F.col("id") % F.lit(4) == F.lit(0), F.lit("featured"))
    .otherwise(F.lit("standard"))
    .alias("segment"),
)
第一個 phase 以 F.broadcast(dimension) 明確告訴 Spark dimension side 可以 broadcast;第二個 phase 將 spark.sql.autoBroadcastJoinThreshold 設為 -1,並保留 Sort-Merge join 偏好,讓同一個 join 改採 SortMergeJoin。兩者最後都執行 count()。
broadcast_join = fact.join(F.broadcast(dimension), "product_id")

spark.conf.set("spark.sql.autoBroadcastJoinThreshold", "-1")
shuffle_join = fact.join(dimension, "product_id")
為了穩定看到八個 shuffle partitions,我將 AQE 關閉,並設定 spark.sql.shuffle.partitions=8。這是觀察用條件,不是 production 的通用設定。
先從 SQL / DataFrame 的 plan 看 broadcast phase。右側 dimension branch 經過 BroadcastExchange,再進入 BroadcastHashJoin;左側 1,000,000-row fact branch 可以直接往下處理。
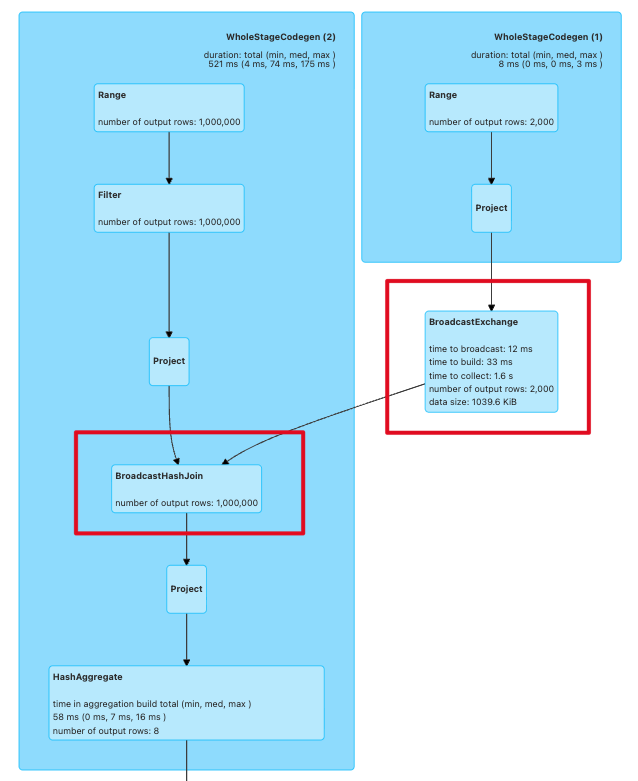
畫面中 BroadcastExchange 顯示它建立了 2,000 rows、約 1039.6 KiB 的 broadcast relation。這個數字比單看「2,000 rows」更有意義:Spark 真正要送往每個 Executor 的是序列化後的 relation。真實 job 是否適合 broadcast,還要看欄位寬度、資料型別、每個 Executor 的 memory,以及同時有多少 broadcast datasets 存活。
Job DAG 也讓我看見資料移動的範圍。join 的 fact-side Stage 沒有在 BroadcastHashJoin 前出現依 product_id 的 Exchange;DAG 中的 Exchange 位於 join 後的 HashAggregate,它屬於最後 count() 的彙總。
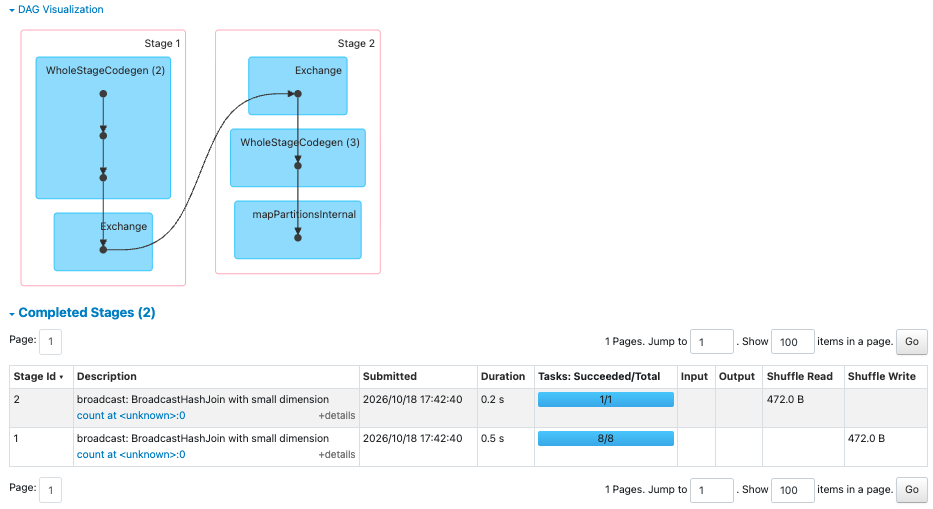
Completed Stages 表證實這個尾端 shuffle 很小:上游 Stage 寫出 472.0 B,最後一個單 task Stage 讀回同樣的 472.0 B。這是八個 partial counts 合併成一個最終 count 的資料,而不是 1,000,000 rows 為 join 重新分配。
這個細節很容易讓我誤判。看到 Exchange 或 Shuffle Write 時,先問它在 DAG 的哪個位置、上下游 operator 是什麼;不能只因為某個 Job 有 shuffle,就直接說它用了 shuffle join。
Jobs 頁實際留下三個 completed Jobs。第一個是 Spark 準備 broadcast relation 的 Job,有一個 Stage、八個 tasks;第二個才是標示為 broadcast 的 count action,有兩個 Stages、九個 tasks。第三個是接下來的 shuffle join。
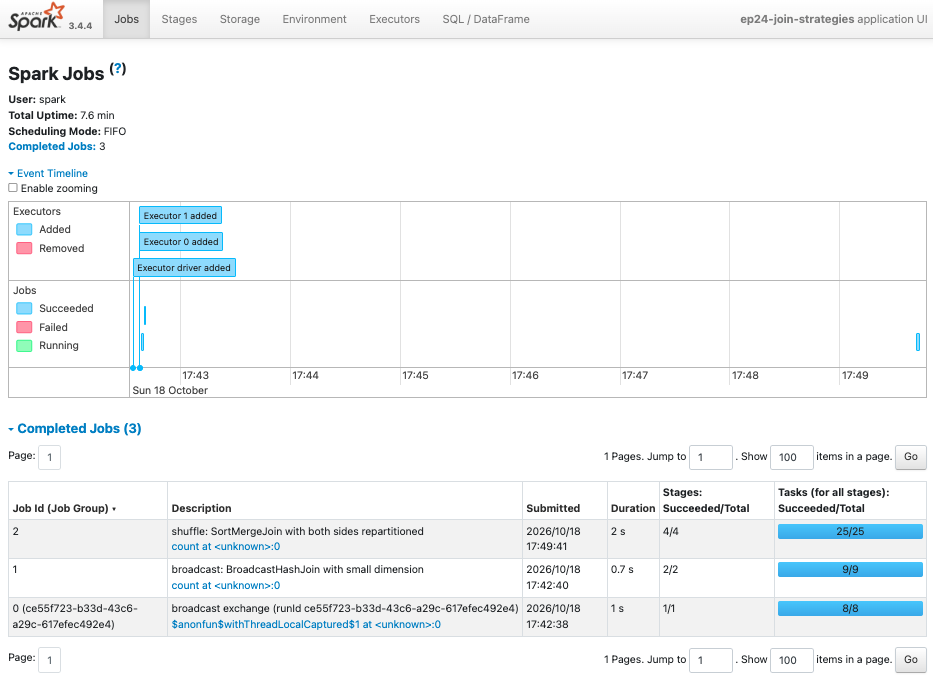
這也延續 Ep22 的時間層級:一個 SQL execution 的完成時間,和某一個 Job 的 duration 不一定相同。broadcast relation 的建立可以形成獨立 Job;閱讀 UI 時要把 Description、Job IDs、DAG 與 SQL plan 放在一起,才不會把前置工作漏掉。
第二個 phase 停用 auto-broadcast 後,formatted physical plan 的 dimension branch 明確出現:
Exchange hashpartitioning(product_id, 8)
    ↓
Sort(product_id)
    ↓
SortMergeJoin
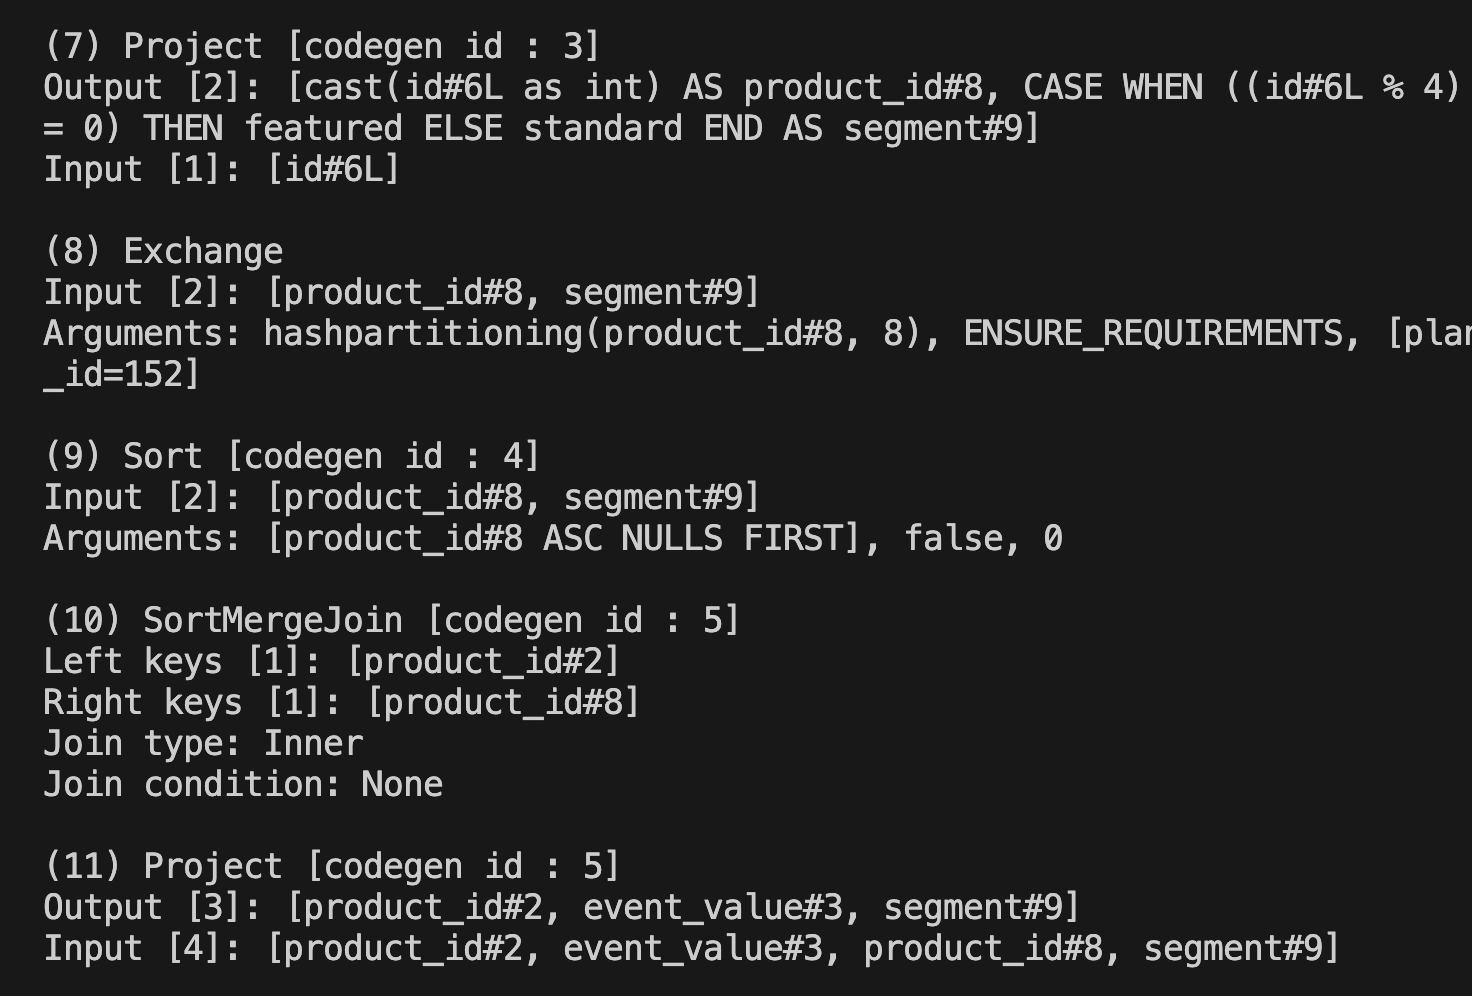
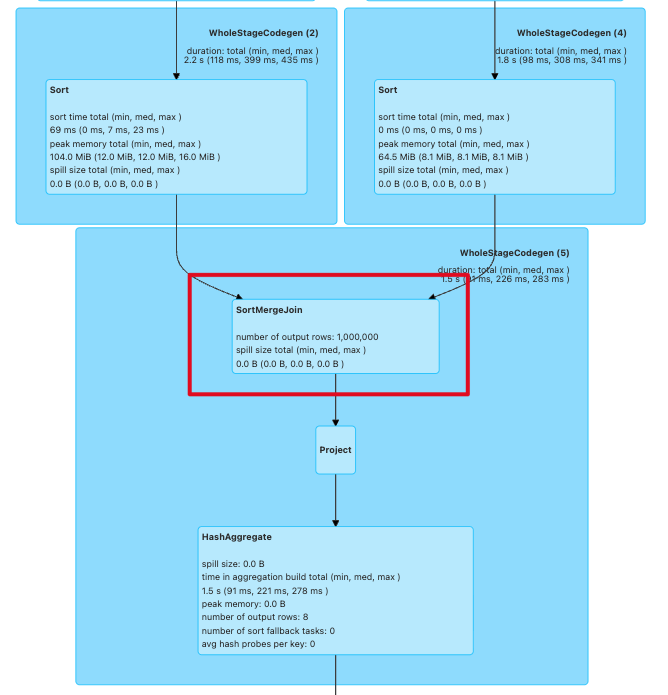
fact branch 也遵循同樣規則。因為兩側原本都沒有被保證依 product_id 分布,Spark 必須替兩邊各建立 Exchange。SQL plan 裡的兩個 Sort 收斂到同一個 SortMergeJoin,就是這個策略的骨架。
Job DAG 將這份 plan 轉成可量化的資料流。Stage 3 與 Stage 4 各有八個 tasks,分別寫出 14.6 KiB 與 972.9 KiB shuffle data;後續 Stage 5 的八個 tasks 讀回 987.5 KiB,進行 SortMergeJoin,然後才為 count() 寫出 472.0 B。
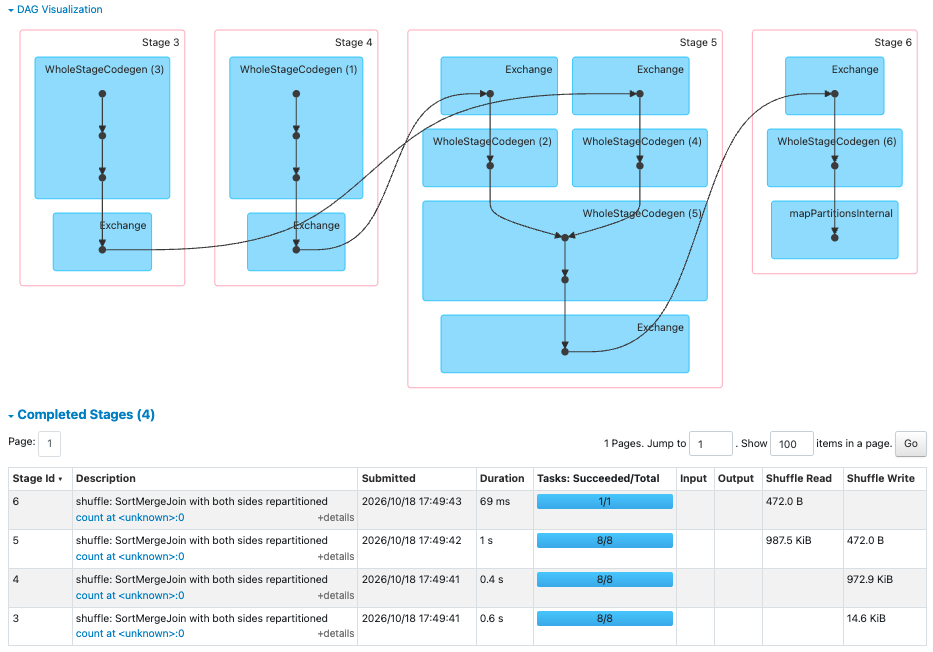
這是比單看 duration 更可靠的對照。這次 shuffle Job 有四個 Stages、25 個 tasks;broadcast count action 有兩個 Stages、九個 tasks。資料很小,所以 Jobs 頁分別只顯示 2 秒和 0.7 秒,不能把這些數字當成一般環境的效能比例;但 Stages、Exchange 與 Shuffle Read/Write 清楚說明兩種策略做了不同的工作。
| 先看到的訊號 | 這次能確認的事 | 下一個要問的問題 |
|---|---|---|
BroadcastHashJoin + BroadcastExchange |
小的一側被複製給 Executors;大型一側無須為 join key shuffle。 | broadcast relation 的序列化大小、Executor memory 與同時執行的查詢是否允許? |
SortMergeJoin + 兩側 Exchange |
join 前兩側依 key 重分配;shuffle 是策略的一部分。 | 哪一側大?join key 有沒有 skew?資料能否提早 filter 或只選必要欄位? |
| join 後的小型 Exchange | 下游 aggregation 或 count 還有自己的資料交換。 | 這個 Exchange 是 join 所需,還是後續 operator 所需? |
| 少數 shuffle task 同時有巨大 records 與 duration | 可能又回到 key 分布不均。 | 回看 Ep23:hot key 是否讓某個 partition 變成 straggler? |
先由 physical plan 確認 Spark 選了哪種 join,再用 DAG 與 Stage metrics 驗證資料真的如何移動;這比直接調整 broadcast threshold 更有方向。
同一句 fact.join(dimension, "product_id") 背後,可以是把小表送到每個 Executor 的 BroadcastHashJoin,也可以是兩側都重新分配與排序的 SortMergeJoin。這個差異會具體出現在 BroadcastExchange、Exchange、Sort、Stage 數、task 數與 shuffle metrics。
這次我也學到,UI 出現 shuffle 不足以判定 join strategy;它可能只是 count() 或下游 aggregation 的尾端彙總。先將 Exchange 接回相鄰的 operators,再看 physical plan,才能分辨它是 join 的必要資料移動,還是下一步計算造成的交換。
下一篇會從 join 與 shuffle 回到資料讀取端:當 task 數量很多、每個 task 卻很短時,小檔案如何讓 Spark 忙著啟動與排程工作,而不是有效處理資料。
🚀 GitHub:
Ep24|join 為什麼常是效能分水嶺?從 BroadcastHashJoin 到 SortMergeJoin 看資料怎麼移動
🚀 spark-learning-lab 系列文章與實作:
https://github.com/jeffery5bai/spark-learning-lab
Apache Spark 3.4.4 — Performance Tuning:
https://archive.apache.org/dist/spark/docs/3.4.4/sql-performance-tuning.html
Apache Spark 3.4.4 — Web UI:
https://archive.apache.org/dist/spark/docs/3.4.4/web-ui.html

 jeffery5bai

 iThome鐵人賽
 看影片追技術