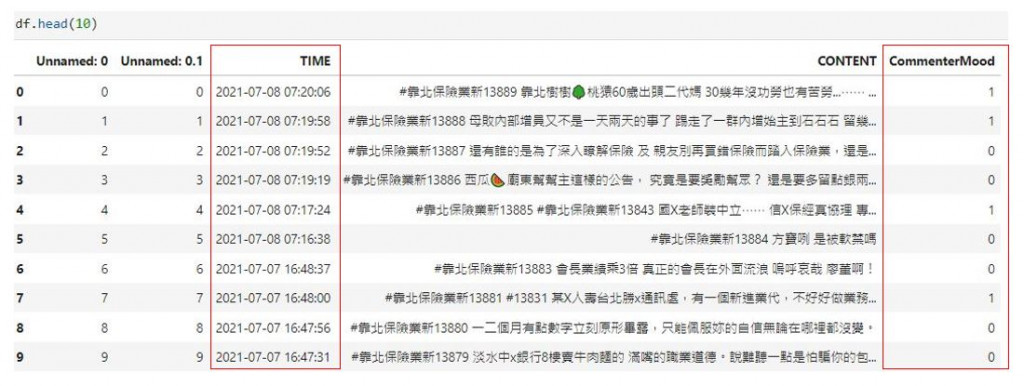
不太清楚. 如何用 Python 3.x Matplotlib 畫出動態兩條折線圖 時間軸 (Time) 和分別各是 Commenter Mood (1) / Commenter Mood (0)? 需要大家幫忙, 提供一下做法. 謝謝.!
已邀請的邦友 {{ invite_list.length }}/5
一個入門小範例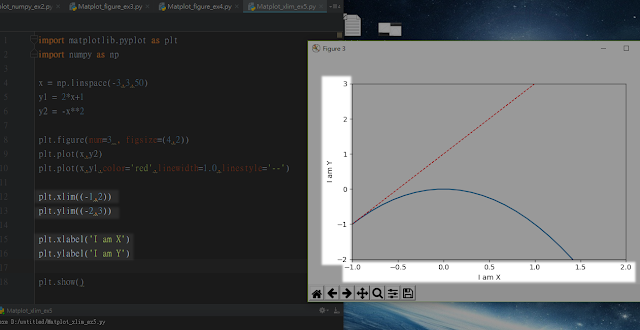
import matplotlib.pyplot as plt
import numpy as np

x = np.linspace(-3,3,50)
y1 = 2*x+1
y2 = -x**2

plt.figure(num=3 , figsize=(4,2))
plt.plot(x,y2)
plt.plot(x,y1,color='red',linewidth=1.0,linestyle='--')

plt.xlim((-1,2))
plt.ylim((-2,3))

plt.xlabel('I am X')
plt.ylabel('I am Y')

plt.show()
參考
https://coolmandiary.blogspot.com/2017/06/windowspythonopencvpillowmatplotlibsele.html

 iThome鐵人賽