今天將探討MySQL的Table Cache.
在前面的MySQL Quick Report中,
有一個Section是 Table Cache Section,
Table Cache Section:
              Cache Number -     400
               Open Tables -      48
             Usage Percent -   12.00 %
Cache Number 就是在MySQL設定檔中指定的 Table Cache 數目, Open Tables
就是現在使用中的Tables數目,Usage Percent就是兩者換算的使用百分比,
Quick Report 是快速顯示讓我們了解,若能夠長期監控觀察其數值,
進而適當的調整Cache的數目,讓MySQL可以運作的更順暢.
MySQL尚有一個狀態參數叫作 Opened_tables,代表的意義就是MySQL現在運作時,
有多少Tables曾經被要求開啟,可以用以下公式
open_tables / opened_tables * 100 %
來評估 Table Cache的Hit Rate.
接下來我們將建立rrd,獲取Usage Percent與Hit Rate,來作監控.
首先還是建立rrd的程式.
#!/usr/bin/env python
# ------------------------
# Python RRDTool MySQL
# MySQL Table Cache
# create rrd file
# -----------------------

import rrdtool

rrdtool.create(
    'mysql2.rrd', '--step', '60',
    'DS:usage:GAUGE:120:0:U',
    'DS:hit:GAUGE:120:0:U',
    'RRA:AVERAGE:0.5:1:2880',
    'RRA:AVERAGE:0.5:30:672',
    'RRA:AVERAGE:0.5:60:744',
    'RRA:AVERAGE:0.5:720:732',
    'RRA:MAX:0.5:1:2880',
    'RRA:MAX:0.5:30:672',
    'RRA:MAX:0.5:60:744',
    'RRA:MAX:0.5:720:732',
    'RRA:MIN:0.5:1:2880',
    'RRA:MIN:0.5:30:672',
    'RRA:MIN:0.5:60:744',
    'RRA:MIN:0.5:720:732',
    'RRA:LAST:0.5:1:2880',
    'RRA:LAST:0.5:30:672',
    'RRA:LAST:0.5:60:744',
    'RRA:LAST:0.5:720:732')
獲取與儲存的程式
#!/usr/bin/env python
# ------------------------
# Python RRDTool MySQL
# MySQL Table Cache
# update rrd file
# -----------------------

import rrdtool
import mysql.connector
import time

config = {
    'user' : 'myperf',
    'password' : 'myperf',
    'host' : '127.0.0.1',
    'database' : 'myperf',
}


var = {'open' : "table_open_cache"}
stmt1 = 'SHOW GLOBAL VARIABLES LIKE %(open)s'
stmt2 = 'SHOW GLOBAL STATUS'

def update_cache_rrd(rrdfile):
    cnx = mysql.connector.connect(**config)
    cursor = cnx.cursor()

    cursor.execute(stmt1, var)
    item, table_open_cache = cursor.fetchone()
    table_open_cache = float(table_open_cache)

    cursor.execute(stmt2)
    for item, val in cursor:
        if item == 'Open_tables':
            open_tables = val
            open_tables = float(open_tables)
        if item == 'Opened_tables':
            opened_tables = val
            opened_tables = float(opened_tables)
    #

    table_cache_hit_rate = open_tables / opened_tables * 100
    table_cache_usage = open_tables / table_open_cache * 100

    rrdtool.update('mysql2.rrd', 'N:' + `table_cache_usage` + ':' + `table_cache_hit_rate`)

    cursor.close()
    cnx.close()
#
if __name__ == '__main__':
    while 1:
        update_cache_rrd('mysql2.rrd')
        time.sleep(60)
放到背景執行,會每分鐘更新rrd.
再來就是繪圖的程式.
#!/usr/bin/env python
# ---------------------------
# Python RRDTool
# MySQL Table Cache
# Create Image from rrd file
# ---------------------------

import rrdtool
import datetime

def mysql_graph2(rrdfile, period):
    timenow = datetime.datetime.now()
    disptime = datetime.datetime.strftime(timenow, '%Y-%m-%d %H-%M-%S')
    title = 'MySQL_Table_Cache_%s' % period
    filename = title + '.png'

    # -------------------
    usage = 'DEF:usage=%s:usage:AVERAGE' % rrdfile
    hit = 'DEF:hit=%s:hit:AVERAGE' % rrdfile

    # -------------------
    if period == 'yesterday':
        start = 'end-1d'
        end = '00:00'
    if period == 'today':
        start = '00:00'
        end = '23:59'
    if period == '2h':
        start = '-2h'
        end = 'now'
    if period == '4h':
        start = '-4h'
        end = 'now'

    rrdtool.graph(
        filename,
        '--start', start,
        '--end', end,
        '--title', title,
        '-a', 'PNG',
        '-W', 'Hitomitanaka for ITHelp',
        '--slope-mode',
        '--vertical-label=Percent',
        '--rigid',
        '--upper-limit', '100',
        '--lower-limit', '0',
        '--width', '500',
        '--height', '150',
        '--x-grid', 'HOUR:1:HOUR:2:HOUR:2:0:%H',
        '--alt-y-grid',
        '--color', 'BACK#000000',
        '--color', 'CANVAS#000000',
        '--color', 'FONT#FFF978',
        '--font=LEGEND:7',
        '--font', 'TITLE:8:',
        '--font', 'UNIT:7:',
        '--font', 'WATERMARK:9',
        # ---------------------------------
        usage,
        hit,
        #----------------------------------
        'LINE1:usage#00FF00:Usage Percent',
        'GPRINT:usage:LAST: Current\\: %.01lf',
        'GPRINT:usage:AVERAGE:  Average\\: %.01lf',
        'GPRINT:usage:MIN:  Min\\: %.01lf',
        'GPRINT:usage:MAX:  Max\\: %.01lf\\n',
        'LINE1:hit#FF0000:Hit Rate',
        'GPRINT:hit:LAST:      Current\\: %.01lf',
        'GPRINT:hit:AVERAGE:  Average\\: %.01lf',
        'GPRINT:hit:MIN:  Min\\: %.01lf',
        'GPRINT:hit:MAX:  Max\\: %.01lf\\n',
        'COMMENT:\t\t\t\t\tUpdate Time %s' % disptime)
#
if __name__ == '__main__':
    mysql_graph2('mysql2.rrd', '4h')
    mysql_graph2('mysql2.rrd', '2h')
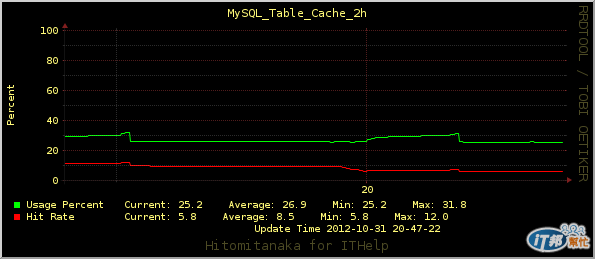
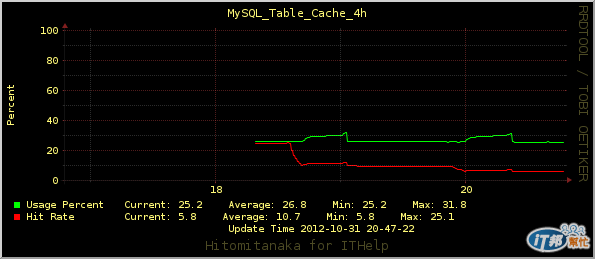
使用簡易的壓力測試,並觀察繪製出來的圖形.


可以看到這期間使用百分比有增加,從 25.2% 到 31%,
參數設定是400個,約增加了24個;Hit Rate迅速降低.
關於Table Cache Hit Rate,需要長期間的觀察,建立系統關於
此數值的Base Line,爾後有變化時,就能有效合理的推論,是
需要調整參數,進而使系統發揮效益.

效能調校的功夫,一般被視為 DBA的職責。不過,系統開發人員,若能善用作者介紹的工具與方法,相信有助於開發高效的資訊系統。