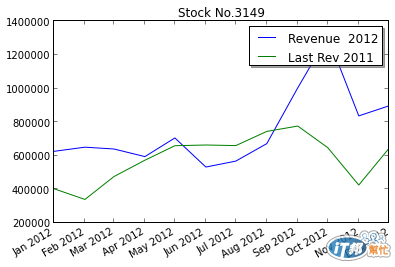
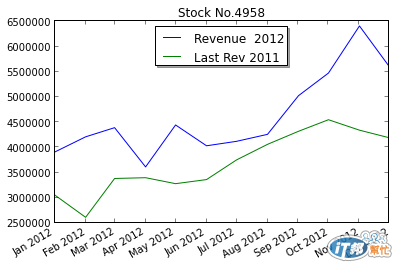
圖上加上一些說明,及資料整合。


之前算是手工抓資料來繪圖,
現在把http://white5168.blogspot.tw/2012/08/blog-post_11.html#.UjnMKN98pNC的抓月營收資料程式,產生12個月的csv檔(sii_201201.csv...sii_201212.csv),
寫個小迴圈,一囗氣寫入sqlite3, 方便下WHERE篩選。
mon=('02','03','04','05','06','07','08','09','10','11','12')
for i in range(len(mon)):
	path='/home/timloo/Revenue/sii_2012'+mon[i]+'.csv'
	with open(path, 'rb') as csvfile:
		rvnreader = csv.reader(csvfile, delimiter=',', quotechar='"')
	    	for row in rvnreader:
			ym='2012'+mon[i]
	        	rvnlst=(ym,row[0],row[1],row[2],row[3],row[4],row[5],row[6],row[7],row[8],
	        		row[9],row[10])
	        	c.execute('INSERT INTO rvn VALUES (?,?,?,?,?, ?,?,?,?,?, ?,?)', rvnlst)
	conn.commit()
把csv檔的路徑用變數path替代,資料表第一個欄位,用ym變數代替年月。
試一下搜尋一整年的月營收,
for row in c.execute("SELECT * FROM rvn where cpy='4958'"):
    print row[0],row[1].encode('utf8'),row[3].encode('utf8'),row[4],row[5]
output:
201201 電子零組件業 F-臻鼎 3907573.0 4190713.0
201201 電子工業 F-臻鼎 3907573.0 4190713.0
201202 電子零組件業 F-臻鼎 4210239.0 3907573.0
201202 電子工業 F-臻鼎 4210239.0 3907573.0
201203 電子零組件業 F-臻鼎 4392057.0 4210239.0
201203 電子工業 F-臻鼎 4392057.0 4210239.0
.............................................
這時候發現,同家公司出現兩次,回源頭的csv檔查看,確實是兩筆。
那就加上一個WHERE條件,濾掉即可
for row in c.execute(u"SELECT * FROM rvn where cpy='4958' AND cls='電子工業'"):
    print row[0],row[1].encode('utf8'),row[3].encode('utf8'),row[4],row[5]
記得字串左邊加個u(u"SELECT ...."),
iInfo先生抓的資料中,有"當月營收","去年當月營收",如果可以一起呈現,就可以看一家公司,兩年(2012/2011)的營收情況。
我們把資料整理出來吧,x表x軸,時間,去年1月到12月,y表y軸,y1是"當月營收",y2是"去年當月營收"
import datetime
import matplotlib.dates as md
x=[];y1=[];y2=[]
for row in c.execute(u"SELECT date,monr,lyrmonr FROM rvn where cpy='4958' AND cls='電子工業'"):
    y=row[0][0:4]
    m=row[0][4:6]
    dt=datetime.datetime(int(y),int(m),1)
    x.append(md.date2num(dt))
    y1.append(row[1])
    y2.append(row[2])

x,y1,y2
接著把圖畫出來
from pylab import figure, show

fig = figure()
ax = fig.add_subplot(111)
ax.set_title('Stock No.4958')
ax.plot_date(x, y1, '-', label='Revenue  2012')  #將日期及營收傳入繪圖函式
ax.plot_date(x, y2, '-', label='Last Rev 2011')  #將日期及營收傳入繪圖函式
fig.autofmt_xdate()
legend = ax.legend(loc='upper center', shadow=True)
show()
畫兩條線,就是呼叫ax.plot_date兩次,所以畫很多線是沒問題的。
這次多了label 和title屬性的介紹。應該可以望碼生義吧。

補上額外的練習:一般可從台灣証交所http://www.twse.com.tw/下載月成交資訊csv檔(201209_F3_1_10_3149.csv),
內容如下:
"101年 3149 正達 月成交資訊(元,股)"
年度,月份,最高價,最低價,加權(A/B)平均價,成交筆數,成交金額(A),成交股數(B),週轉率(%)
101,1,89.30,61.40,72.70,"44,316","5,470,762,050","75,245,634",31.94
101,2,98.10,84.00,90.96,"62,824","8,464,842,783","93,060,192",39.51
.......................................................
101,12,81.10,72.50,76.72,"52,657","6,621,160,391","86,292,192",32.49
說明: 1. 本統計資訊含一般、零股、盤後定價、鉅額交易,不含拍賣、標購。
去掉用不到的中文說明資訊,抓年度,月份,最高價,最低價,加權(A/B)平均價來製圖。
import datetime
import matplotlib.dates as md
x=[];y1=[];y2=[];y3=[]
i=0
with open('/home/timloo/201209_F3_1_10_3149.csv', 'rb') as csvfile:
    rvnreader = csv.reader(csvfile, delimiter=',', quotechar='"')
    for row in rvnreader:
        i=i+1
        j=rvnreader.line_num #行數
        if i>2 and j<15:    #頭兩行,尾一行用不到
            y=int(row[0])+2011 #轉西元年
            m=int(row[1])
            dt=datetime.datetime(y,m,1)
            x.append(md.date2num(dt))
            y1.append(float(row[2]))
            y2.append(float(row[3]))
            y3.append(float(row[4]))

x,y1,y2,y3
接著繪圖
from pylab import figure, show

fig = figure()
ax = fig.add_subplot(111)
ax.set_title('Stock No.3149')
ax.plot_date(x, y1, '-', label='High ')  #將日期及營收傳入繪圖函式
ax.plot_date(x, y2, '-', label='Low  ')  #將日期及營收傳入繪圖函式
ax.plot_date(x, y3, '-', label='Mean ')  #將日期及營收傳入繪圖函式
fig.autofmt_xdate()
legend = ax.legend(loc='right center', shadow=True)
show()
圖在簡述裏!!
**小結:**基本上,傳入任一個股票代號,畫出2012/2011年的營收應該沒問題了。
中文的tilte和label之後會介紹。這次參加COSCUP 2013, 有g0v的組織成員分享很多資料正義的例子,有一個先生寫了一個求職小幫手app,讓求職人方便查詢他將要去面試的公司是否有違反勞工法規的案例。讓他爆紅,因為下載數爆量,被媒體採訪。
其中有一句毛澤東的話,自己動手,豐衣足食。
令我印象深刻。數據一直都存在,為何不自己動手取用?
