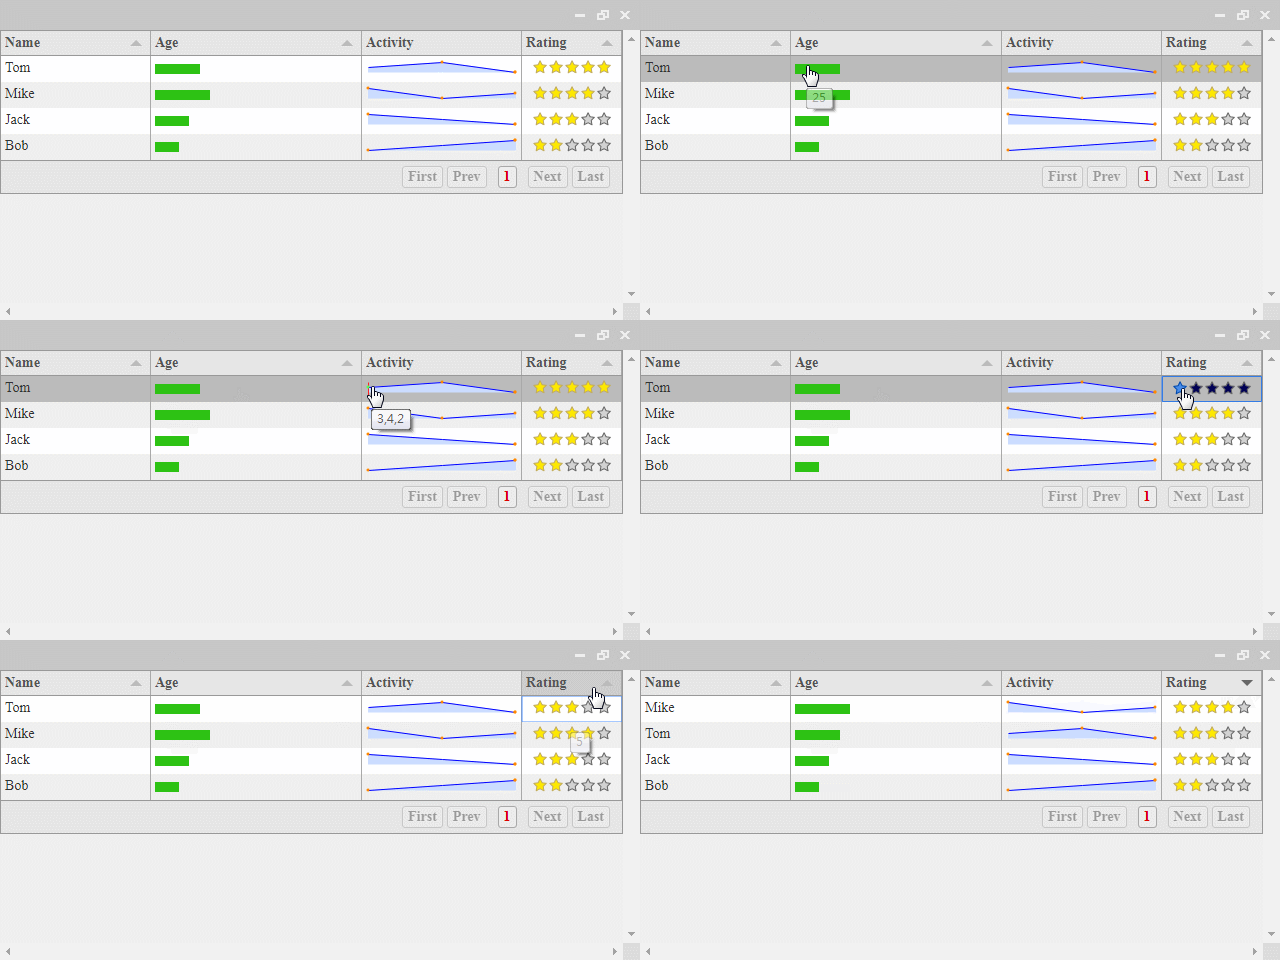
相當容易操作的表格內容產生器,只需要花短短的時間,就可以透過把陣列或JSON格式的資料,產生成HTML介面的表格。並支援響應式網頁,以及可以運用其他套件做成物件產生資料圖表
GitHub Star: 500
Javascripting Overall: 41%
瀏覽器: Chrome、Firefox和IE9+
RWD: 支援
License: MIT
CDN
  <!-- jQuery v1.9.1 -->
  <script type="text/javascript" src="https://code.jquery.com/jquery-1.9.1.min.js"></script>
  <!-- jQuery UI v1.9.1 -->
  <link href="https://code.jquery.com/ui/1.9.1/themes/smoothness/jquery-ui.css" rel="stylesheet" />
  <script src="https://code.jquery.com/ui/1.9.1/jquery-ui.min.js"></script>
  <!-- jQuery Sparklines v2.1.2 -->
  <script src="https://cdnjs.cloudflare.com/ajax/libs/jquery-sparklines/2.1.2/jquery.sparkline.min.js"></script>
  <!-- Tabulator v3.4.0 -->
  <link href="https://cdnjs.cloudflare.com/ajax/libs/tabulator/3.4.0/css/tabulator.min.css" rel="stylesheet" />
  <script type="text/javascript" src="https://cdnjs.cloudflare.com/ajax/libs/tabulator/3.4.0/js/tabulator.min.js"></script>
$ npm install jquery.tabulator --save
$ bower install tabulator --save
  <div id="example"></div>
  <script>
  	var lineFormatter = function( cell, formatterParams )
  	{
  		setTimeout(function(){
  			// 自訂圖表欄位模式,透過 jQuery Sparklines 產生圖表
  			cell.getElement().sparkline(cell.getValue(), {width:"100%", type:"line", disableTooltips:true});
  		}, 10);
  	};
  	$( "#example" ).tabulator({
  		// 參數設定[註1]
  		height: "auto", // 表格高度
  		layout: "fitColumns", // 表格風格
  		tooltips: true, // 顯示欄位提示訊息
  		addRowPos: "top", // 新增欄位位置
  		history: true, // 歷史紀錄
  		pagination: "local", // 顯示分頁
  		paginationSize: 7, // 分頁數量
  		resizableRows: true, // 可縮放欄位
  		columns:[
  			//資料格式設定
  			{ 	title: "Name", // 標題名稱
  				field: "name", // 欄位名稱
  				width: 150 // 欄位寬度
  			},
  			{
  				title: "Age",
  				field: "age",
  				align: "left",// 靠齊方向
  				formatter: "progress" // 欄位模式(列表[註2])
  			},
  			{
  				title: "Activity",
  				field: "activity",
  				width: 160,
  				formatter: lineFormatter,
  				headerSort: false
  			},
  			{
  				title: "Rating",
  				field: "rating",
  				formatter: "star",
  				align: "center",
  				width: 100,
  				editor: true // 可編輯
  			}
  		],
  		rowClick:function( e, row )
  		{
  			// 當欄位被點選時,則執行此函式
  			alert( "ID: " + row.getData().id + "" );
  		}
  	});
  	var tabledata = [
  		// 表格內容
  		{id:1, name:"Tom", age:"25", activity: [ 3,4,2 ], rating: 5 },
  		{id:2, name:"Mike", age:"30", activity: [ 3,1,2 ], rating: 4 },
  		{id:3, name:"Jack", age:"20", activity: [ 3,2,1 ], rating: 3 },
  		{id:4, name:"Bob", age:"15", activity: [ 1,2,3 ], rating: 2 }
  	];

  	$( "#example" ).tabulator( "setData", tabledata );
[註1]
| 參數 | 描述 |
|---|
height|表格高度
layout|表格風格
tooltips|顯示欄位提示訊息
addRowPos|新增欄位位置
history|歷史紀錄
pagination|顯示分頁
paginationSize|分頁數量
pagination|顯示分頁
resizableRows|可縮放欄位
columns.title|標題名稱
columns.field|欄位名稱
columns.title|欄位寬度
columns.align|靠齊方向
columns.formatter| 欄位模式(列表[註2])
columns.editor|可編輯
rowClick( event, 【欄位】)|當欄位被點選時,則執行此函式
[註2]
| 參數 | 描述 |
|---|
plaintext|本文
textarea|多行
html|HTML
money|金錢(範例: 1000 => 1,000)
image|圖片
link|超連結
tick|true或1會變成綠色V,否則空格
tickCross|true或1會變綠色V,否則紅色X
color|背景顏色
star|星星
progress|進度條
