The brief structure leading to the milestone of PCA is as below:
1. Statistical Introduction
2. Transformation of Vectors in Spaces
3. Orthogonal Projection
Hi, Happy Sunday Night!
We talked about mean value yesterday.
Let's move further based on what we learned from mean value: Variance.
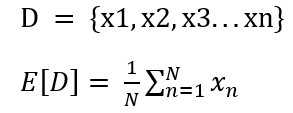
Like the formula below, mean value tells us a single fact in a dataset. But how this single fact is produced is another story that we can observe via variance. Two datasets with the same mean value could have a significant difference in variance. More technically, it means the different ways of spreading data points.


Take a stock market as an example, two companies in a stock market can get the same mean value for their prices within a month. However, one company could have a very high price in the start of the month and then continue to drop down in the following days. On the other hand, the other company remained stable from the beginning of the month all the way to the last day. Though both of them have the same mean value, which one will you choose?
