練習用pandas dataframe功能讀取csv檔並作簡單統計指標運算
第一步:自備一個csv檔
第二步:確定已經安裝numpy, matplotlib
第三步:再有練習資料夾的command line路徑下,開啟python jupyter notebook
第四步:匯入numpy, matplotlib, pandas,並且分別命名為np, plt, pd物件名稱
第五步:用ls瀏覽一下資料夾

第六步:用panda物件讀取cvs檔案,方法是read_cvs
df=pd.read_csv("data1.csv")
接下來,便可用df物件,印出想要看到的資料範圍
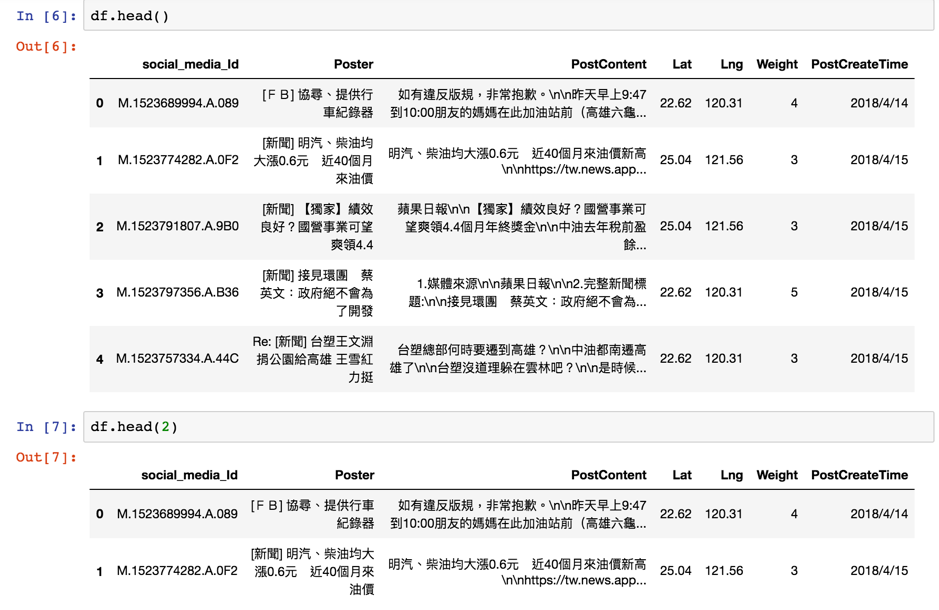
例如df.head(0)是印出欄位
df.head()會印出欄位以及前五筆內容
df.head(2)會印出欄位以及前兩筆內容

範例資料是一個社群媒體文章集,欄位包含ID, 標題Poster, 內文PostContent, 經度Lst, 緯度(Lng), 情緒值(Weight, 1非常不滿意~5 非常滿意), 日期(PostCreateTime)

讀取特定欄位用df[“欄位名稱”]或是df.欄位名稱
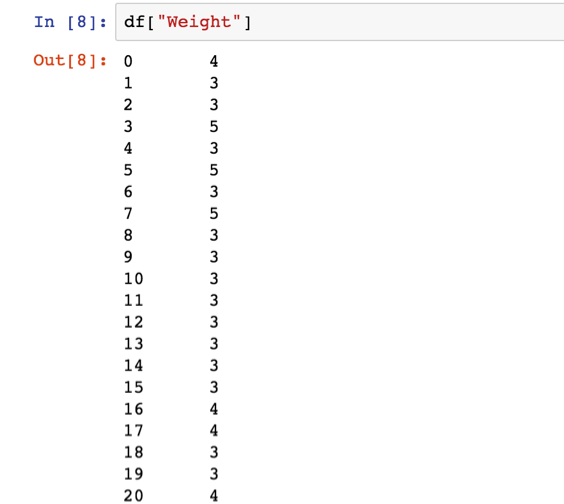
例如我要印出weight這個欄位的內容
就用df[“Weights”]印出欄位內的所有值

如果我們想計算Weight的平均數與標準差,則先將df.Weight.values指定給一個cg變數,再用cg變數計算平均數與標準差
cg=df.Weight.values
cg.mean() #印出平均值
cg.std() #印出標準差

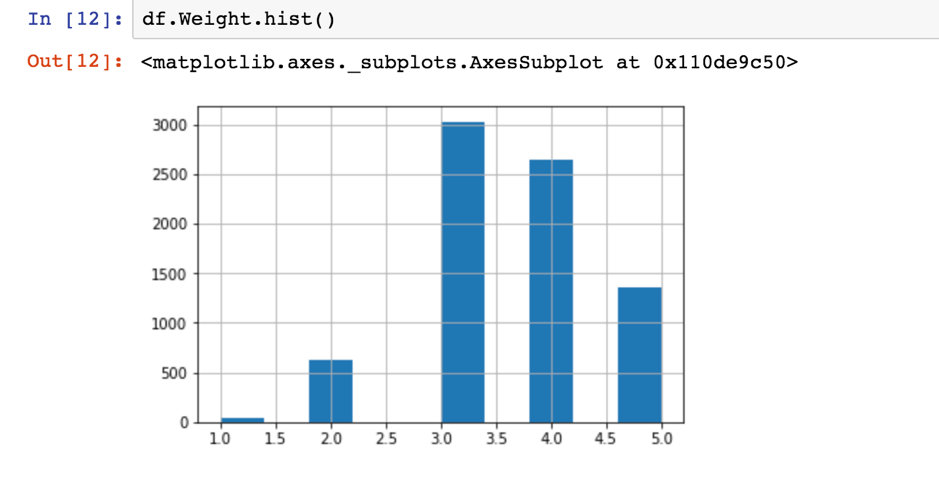
用df.Weight.hist()則可以印出Weight欄位內所有值的直方分佈圖

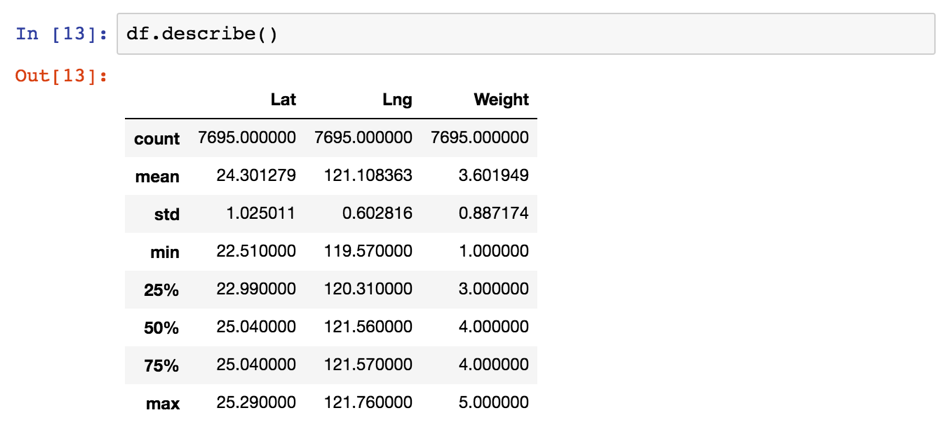
df.describe()則將基本的敘述統計指標一次整理成一個表列出來,很方便 :)

參考資料
成為python數據分析達人的第一課(自學課程)
http://moocs.nccu.edu.tw/course/123/intro
Kevinya's blog
https://dotblogs.com.tw/kevinya/2018/06/04/124135
