%matplotlib inline
import pandas as pd
import matplotlib.pyplot as plt

plt.rcParams['figure.figsize'] = (15, 10)
plt.rcParams['font.sans-serif']='STZhongsong'
plt.rcParams['axes.unicode_minus'] = False
data50=pd.read_csv('data0050_1029.csv')
data50.head()
<table border="1" class="dataframe">
  <thead>
    <tr style="text-align: right;">
      <th></th>
      <th>市場別</th>
      <th>產業別</th>
      <th>name</th>
      <th>code</th>
      <th>date</th>
      <th>成交股數</th>
      <th>成交金額</th>
      <th>開盤價</th>
      <th>最高價</th>
      <th>最低價</th>
      <th>...</th>
      <th>外陸資賣出</th>
      <th>投信買賣超</th>
      <th>投信買進</th>
      <th>投信賣出</th>
      <th>自營商買賣超</th>
      <th>自營商買賣超避險</th>
      <th>自營商買進</th>
      <th>自營商買進避險</th>
      <th>自營商賣出</th>
      <th>自營商賣出避險</th>
    </tr>
  </thead>
  <tbody>
    <tr>
      <th>0</th>
      <td>上市</td>
      <td>NaN</td>
      <td>元大台灣50</td>
      <td>50</td>
      <td>2018/01/16</td>
      <td>3955</td>
      <td>335496</td>
      <td>84.65</td>
      <td>85.00</td>
      <td>84.50</td>
      <td>...</td>
      <td>1004.0</td>
      <td>0.0</td>
      <td>0.0</td>
      <td>0.0</td>
      <td>0.0</td>
      <td>39.0</td>
      <td>0.0</td>
      <td>487.0</td>
      <td>0.0</td>
      <td>448.0</td>
    </tr>
    <tr>
      <th>1</th>
      <td>上市</td>
      <td>NaN</td>
      <td>元大台灣50</td>
      <td>50</td>
      <td>2018/01/17</td>
      <td>5698</td>
      <td>485174</td>
      <td>84.65</td>
      <td>85.45</td>
      <td>84.65</td>
      <td>...</td>
      <td>35.0</td>
      <td>-250.0</td>
      <td>0.0</td>
      <td>250.0</td>
      <td>-844.0</td>
      <td>-825.0</td>
      <td>57.0</td>
      <td>607.0</td>
      <td>901.0</td>
      <td>1432.0</td>
    </tr>
    <tr>
      <th>2</th>
      <td>上市</td>
      <td>NaN</td>
      <td>元大台灣50</td>
      <td>50</td>
      <td>2018/01/18</td>
      <td>6898</td>
      <td>594091</td>
      <td>85.50</td>
      <td>86.55</td>
      <td>85.50</td>
      <td>...</td>
      <td>101.0</td>
      <td>257.0</td>
      <td>377.0</td>
      <td>120.0</td>
      <td>399.0</td>
      <td>1989.0</td>
      <td>516.0</td>
      <td>2135.0</td>
      <td>117.0</td>
      <td>146.0</td>
    </tr>
data50=data50.set_index('date')
rolling
可以算5MA、20MA.....
Parameters:
window : int, or offset
可以取數字為一個區間計算或用offset
offset可以看http://pandas.pydata.org/pandas-docs/stable/timeseries.html#offset-aliasesmin_periods : int, default None
區間最少要有多少筆數據,window是int跟window一樣
window是offset預設是1center : boolean, default False
可以改True把值放中間,前後會是NaNwin_type : string, default None
不同權重的窗口,根據不同方法
https://docs.scipy.org/doc/scipy/reference/signal.html#window-functionsclosed : string, default None
區間的開閉
一般大概只會用到window
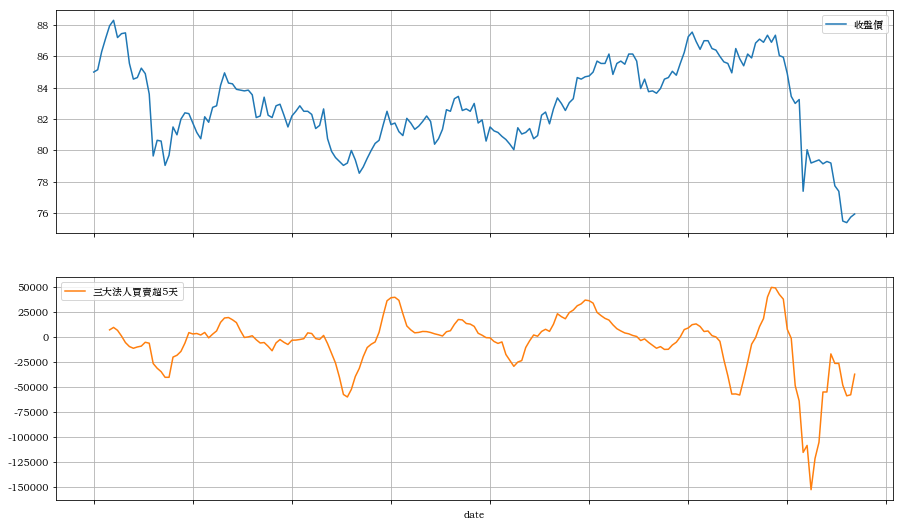
data50['三大法人買賣超5天'] = data50['三大法人買賣超'].rolling(window=5).sum()

data50[['收盤價', '三大法人買賣超5天']].plot(subplots=True, figsize=(15, 10), grid=True)
array([<matplotlib.axes._subplots.AxesSubplot object at 0x00000215918EA710>,
       <matplotlib.axes._subplots.AxesSubplot object at 0x0000021591C272B0>],
      dtype=object)

可以由圖看出"三大法人買賣超5天累積"跟"收盤價" 兩者有相關
算兩者窗口的相關係數
https://pandas-docs.github.io/pandas-docs-travis/generated/pandas.core.window.Rolling.corr.html
data50['三大法人買賣超'].rolling(5).corr(data50['收盤價']).mean()
0.6814114604191231
data50['外陸資買賣超'].rolling(5).corr(data50['收盤價']).mean()
0.6070778475079339
可以知道0050跟外資有關聯,不過這是大家都知道的事,如果要有預測效果我們位移10天(shift(10)),用10天前的資料算5天窗口的未來收盤價的係數平均
data50['三大法人買賣超'].shift(10).rolling(5).corr(data50['收盤價']).mean()
0.4668449871862564
還是有滿不錯的相關性,所以針對0050可以用前面10或N天的買賣超作預測的其中一個特徵,再用這種方法找尋有相關的變數,例如費半跟台股大盤的相關性
r = data50.rolling(1)

# dir(r)
rolling除了sum和corr 還可以用以下的方法
'agg',
'aggregate',
'apply',
'code',
'corr',
'count',
'cov',
'exclusions',
'is_datetimelike',
'is_freq_type',
'kurt',
'max',
'mean',
'median',
'min',
'name',
'ndim',
'quantile',
'skew',
'std',
'sum',
'validate',
'var',
