這篇文章會示範如何安裝並使用 APM (Application Performance Monitoring) 傳送 Node.js 服務狀態到 Elasticsearch 中,並使用 Kibana 即時監控相關資料。
APM 是 Application Performance Monitoring 的縮寫,主要是即時監控軟體服務的工具,會蒐集效能相關資訊像是 request 回應時間、資料庫 query 時間等等,幫助我們更快找到效能瓶頸去修正。
為什麼服務的監控很重要?
解決的痛點:
Server 端實作大致分成幾個步驟
npm install express --save
/ 一般 API/slow 回應很慢的 API/erro 拋出錯誤的 APIconst app = require("express")();
app.get("/", function (req, res) {
res.json("Hello World!");
});
app.get("/slow", function (req, res) {
setTimeout(() => {
res.json("Hello World!");
}, 50);
});
app.get("/error", function (req, res) {
apm.captureError(err);
res.status(500);
});
app.listen(3000);
Client 端就是在瀏覽器一直打 API,方便我們之後看報表
function test() {
  for (let index = 0; index < 999; index++) {
    fetch("/");
    fetch("/slow");
    if (index % 17) {
      fetch("/error");
    }
  }
}
npm install elastic-apm-node --save
apm.captureError(err);
// Add this to the VERY top of the first file loaded in your app
var apm = require("elastic-apm-node").start({
  // Override service name from package.json
  // Allowed characters: a-z, A-Z, 0-9, -, _, and space
  serviceName: "",

  // Use if APM Server requires a token
  secretToken: "",

  // Set custom APM Server URL (default: http://localhost:8200)
  serverUrl:
    "https://18f3dcb3963748b7b2014755329bded7.apm.asia-east1.gcp.elastic-cloud.com:443",
});

app.get("/error", function (req, res) {
  var err = new Error("Ups, something broke!");
  apm.captureError(err);
  res.status(500);
});
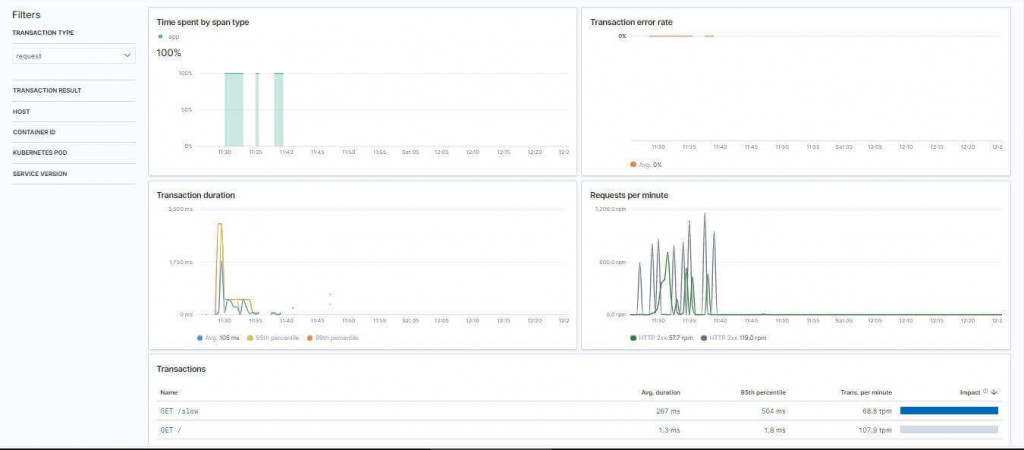
目標是讓 APM 的紀錄進來,所以到 Kibana 選單中 Observability 的 APM 監控,有幾個方便的功能:
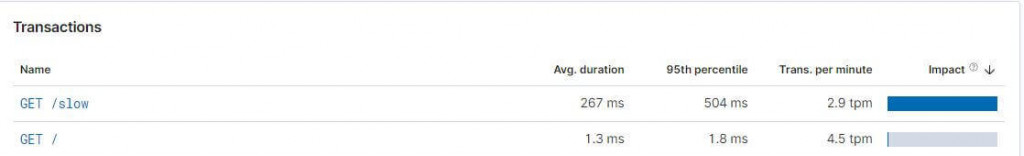
Transactions 記錄各個 API 花了多少時間
時間維度的圖表
各 API 分析,Slow 明顯比較慢
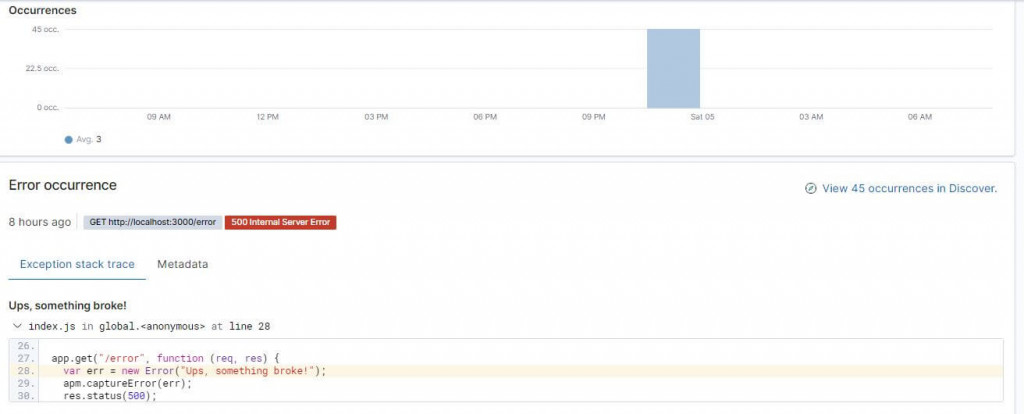
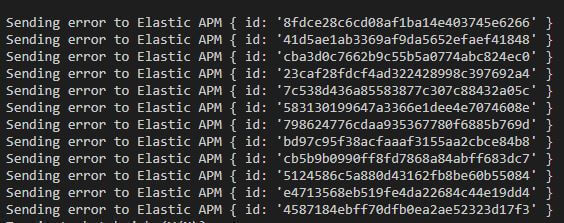
Errors 記錄錯誤是在哪裏發生
可以看出發生的行數
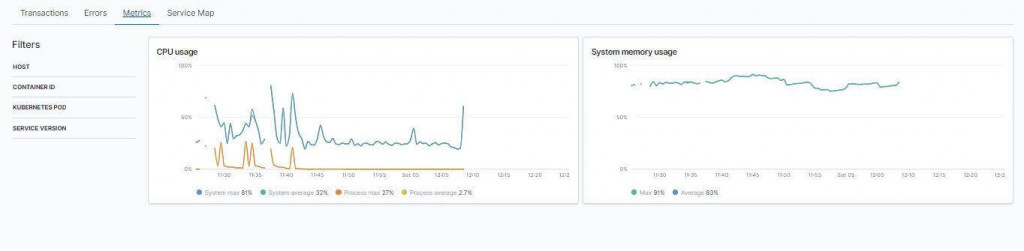
Metrics 基本硬體資訊紀錄
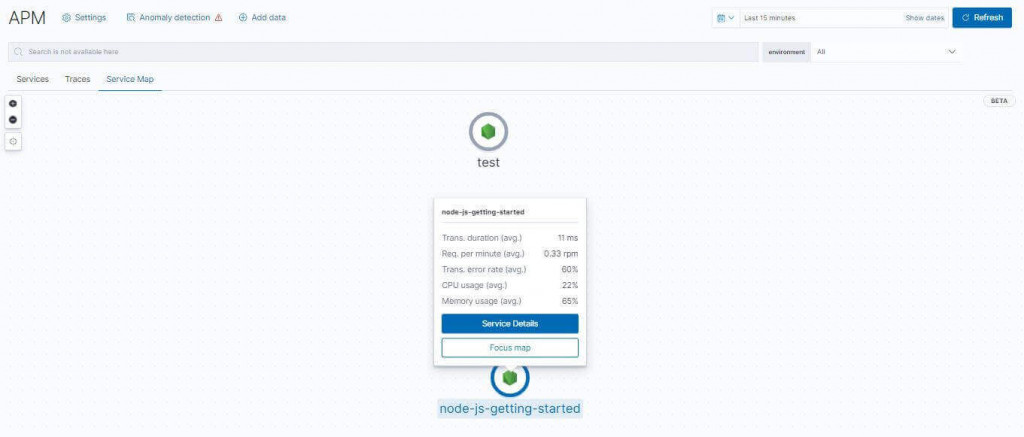
Service Map 所有的服務地圖