Consul的監控上有支援幾種不同的工具,如Circonus, Telegraf, Datadog, Promethesu.
今天會來介紹如何使用Prometheus來監控Consul.
telemetry 參數如下,然後重啟生效。telemetry {
prometheus_retention_time = "10s"
disable_hostname = false
}
# monitor-policy.hcl
agent_prefix "" {
  policy = "read"
}
$ consul acl policy create -name "monitor" -rules @monitor-policy.hcl
ID:           7f1f0f3d-115e-ba86-6661-c5d5328983b0
Name:         monitor
Description:
Datacenters:
Rules:
agent_prefix "" {
  policy = "read"
}
$ consul acl token create -description "monitor" -policy-name monitor
AccessorID:       7278447d-305d-aec5-7488-daf74043c83a
SecretID:         3f3ffbf4-2bd3-5481-0f44-dc8d63bfdcce
Description:      monitor
Local:            false
Create Time:      2020-09-11 15:01:13.670961441 +0000 UTC
Policies:
   7f1f0f3d-115e-ba86-6661-c5d5328983b0 - monitor
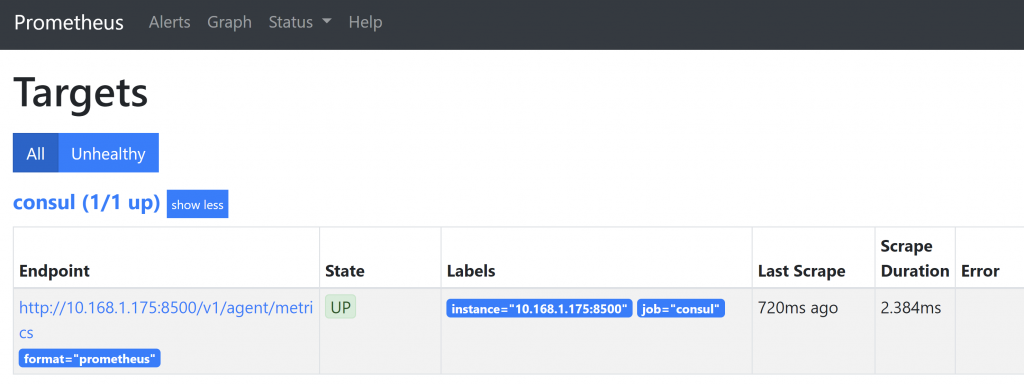
- job_name: 'consul'
    static_configs:
    - targets: ['10.168.1.175:8500']
    scheme: "http"
    tls_config:
      insecure_skip_verify: true
    metrics_path: "/v1/agent/metrics"
    params:
      format: ['prometheus']
    bearer_token: "3f3ffbf4-2bd3-5481-0f44-dc8d63bfdcce"
以上的設定也可以先用curl 來取得資訊
curl --header "X-Consul-Token: 3f3ffbf4-2bd3-5481-0f44-dc8d63bfdcce" http://10.168.1.175:8500/v1/agent/metrics?format=prometheus
除了上述的telemetry 另外也有Consul exporter,
這兩個收集的內容不相同,可以參考連結內說明,評估哪一種比較符合自己的維運,也可以兩個都使用。