資料分隔的過程也可稱為裝箱(binning)。
我們想要分隔的資料經過決策樹訓練後,決策樹給原始資料一個預測值(probability),將資料依序放入所屬的決策樹終點,也就是樹葉端。不同的樹葉端會包含不同數目的資料,每一個樹葉端並不是一個區間,而是一個預測值。用決策樹做離散化時,會建立一個變數和標籤的單調關係,因此可能改善機器學習模型的表現。
優點:
決策樹傳回的預測值和標籤存在著單調關係(monotonic relationships)。
分隔後的資料降低了資料的不確定性(entropy),也就是和其他的bins的資料比較,同一bin或bucket內的資料彼此更相像了。
決策數會自動找出分隔界線。
缺點:
可能會造成over-fitting
有時會較耗時間,因為為了找出最佳的分隔,可能需要調整決策樹的參數(如深度等)。
以 Kaggle 的 Titanic 資料集中的"年齡"變數來說明:
import pandas as pd
import numpy as np
import matplotlib.pyplot as plt
%matplotlib inline
import pylab
import scipy.stats as stats
from sklearn.model_selection import train_test_split
# for discretization
from sklearn.tree import DecisionTreeClassifier, export_graphviz
from sklearn.model_selection import GridSearchCV

data = pd.read_csv('../input/titanic/train.csv', usecols=['Age', 'Fare','Survived'])
data.head

data['Age'] = impute_na(data, 'Age')

X_train, X_test, y_train, y_test = train_test_split(data[['Age', 'Fare']], data.Survived, test_size=0.3,
                                                    random_state=0)
X_train.shape, X_test.shape
建立一個用年齡('Age')來預測存活率('Survived')的決策數模型,並用來分隔年齡資料。
tree_model = DecisionTreeClassifier(max_depth=2, random_state=0)
tree_model.fit(X_train['Age'].to_frame(), y_train)
X_train['age_tree'] = tree_model.predict(X_train['Age'].to_frame())
X_train[['Age', 'age_tree']].head(10)
/| Age| age_tree
------------- | -------------
857| 51.0| 0.372174
52 | 49.0 | 0.372174
386| 1.0 | 0.478261
124| 54.0| 0.372174
578| 19.0| 0.372174
549| 8.0| 0.372174
118 | 24.0| 0.372174
12| 20.0| 0.372174
157| 30.0| 0.372174
127| 24.0| 0.372174
查看決策樹建立幾個樹葉點(bins)
X_train['age_tree'].nunique()
4
查看決策樹建立哪幾個樹葉點(bins or 預測值(predictions))
X_train['age_tree'].unique()
array([0.37217391, 0.47826087, 0.66666667, 1. ])
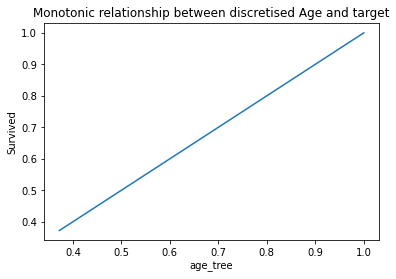
訓練集分隔後年齡和標籤的單調關係(Monotonic relationship)
pd.concat([X_train, y_train], axis=1).groupby(['age_tree'])['Survived'].mean().plot()
plt.title('Monotonic relationship between discretised Age and target')
plt.ylabel('Survived')

分隔測試集並檢視單調關係(Monotonic relationship)
X_test['age_tree'] = tree_model.predict_proba(X_test['Age'].to_frame())[:,1]
pd.concat([X_test, y_test], axis=1).groupby(['age_tree'])['Survived'].mean().plot()
plt.title('Monotonic relationship between discretised Age and target')
plt.ylabel('Survived')

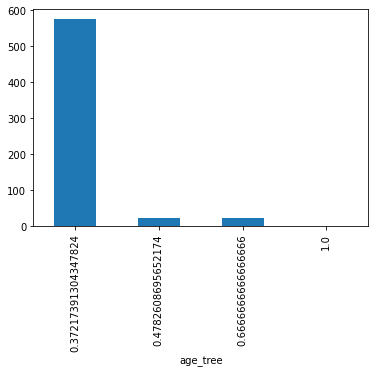
檢視每個bin資料數量的長條圖
X_train.groupby(['age_tree'])['Age'].count().plot.bar()

檢視每個bin資料的年齡界限
pd.concat( [X_train.groupby(['age_tree'])['Age'].min(),
            X_train.groupby(['age_tree'])['Age'].max()], axis=1)
/| Age|Age
------------- | -------------
age_tree| /|/
0.372174| 8.00| 74.0
0.478261| 0.42| 2.0
0.666667| 3.00| 6.0
1.000000| 80.00| 80.0
決策樹產生的四個bins:0.42-2, 3-6, 8-74, 80-80,而他們的存活預測率分別為 0.37, 0.47, 0.66, 1。
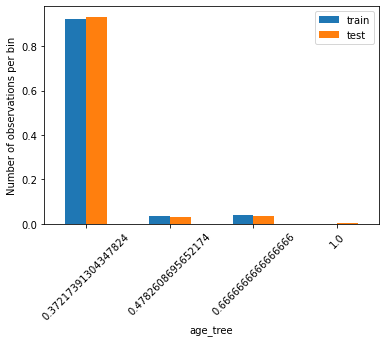
分隔後訓練集與測試集每個bin資料量占全體資料的比率圖:假如訓練集與測試集的原始資料分布情形相似,則分隔後每個bin的資料量站全體資料的比率也會相似。
t1 = X_train.groupby(['age_tree'])['age_tree'].count() / len(X_train)
t2 = X_test.groupby(['age_tree'])['age_tree'].count() / len(X_test)

tmp = pd.concat([t1, t2], axis=1)
tmp.columns = ['train', 'test']
tmp.plot.bar()
plt.xticks(rotation=45)
plt.ylabel('Number of observations per bin')

