5.1 Outlier detection and removal(異常值偵測和移除)
5.2 Treating outliers as missing values(視異常值為遺漏值)
5.3 Top / bottom / zero coding
5.4 Discretisation(資料分隔)
異常值偵測和移除 - 使用Box Plot(箱形圖)
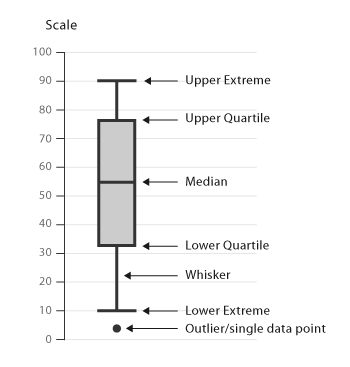
Box Plot(箱形圖)是利用一組資料中的五個統計量:最小值(minimum)、第一四分位數(first quartile or Q1)、中位數(median)、第三四分位數(third quartile or Q3)與最大值(maximum)來顯示資料的分佈情況的統計圖。它也可以告訴我們異常值的位置。
Median(Q2/50th Percentile)中位數:資料集的中間值。
First quartile(Q1/25th Percentile)第一四分位數:資料集中最小的資料值(不是minimum)和中位數之間的中間值。
Third quartile(Q3/75th Percentile)第三四分位數:資料集中最大的資料值(不是maximum)和中位數之間的中間值。
Interquartile range(IQR)四分位間距:第25個百分位數到第75個百分位數。
Maximum(Upper extreme 最大值):
Minimum(Lower extreme 最小值 ):
以 Kaggle 的 Titanic 資料集中的"年齡"變數來說明:
import pandas as pd
import numpy as np
import matplotlib.pyplot as plt
%matplotlib inline
pd.set_option('display.max_columns', None)

data = pd.read_csv('../input/titanic/train.csv')
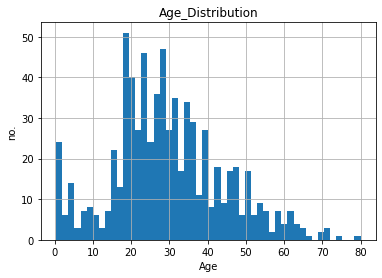
首先,用長條圖檢視年齡變數資料的分布情形:
fig = data.Age.hist(bins=50)
fig.set_title('Age_Distribution')
fig.set_xlabel('Age')
fig.set_ylabel('no.')

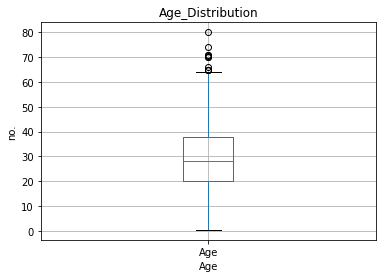
繪製箱形圖。
fig = data.boxplot(column='Age')
fig.set_title('Age_Distribution')
fig.set_xlabel('Age')
fig.set_ylabel('no.')

從上圖可以知道大約有6、7個點位於64-80之間,這些點就是異常值。
我們可以視異常值為遺漏值,使用前面章節講到的差補法插補遺漏資料值。
Top or bottom coding 又稱為 Winsorisation 或 outlier capping。這個方法使用預設值來限定最大值(maximum value)和最小值(minimum value),這個預設值可以是任意值或根據變數的分配情形來決定,如果資料是常態分布,則限定最大值(maximum value)和最小值(minimum value)為平均值加減個標準差;如果資料是偏態分布,可使用四分位數間距法則或取頂端或底端百分位數值。
Top or bottom coding
使用Kaggle的房價預測資料集'LotArea'變數為例,預設值設定為位於95%和5%的資料數值
data = pd.read_csv("../input/house-prices-advanced-regression-techniques/train.csv")
upper_limit = data['LotArea'].quantile(0.95)
lower_limit = data['LotArea'].quantile(0.05)
print('upper limit :', upper_limit)
print('lower limit :', lower_limit)
upper limit : 17400.057500000003
lower limit : 3315.785
'LotArea'變數下的資料,大於最大值(17400.05)或小於最小值(3315.78)的資料值,都將被17400.05或小於3315.78取代
def winsorise(df, variable, upper_limit, lower_limit):
    return np.where(df[variable] > upper_limit, upper_limit,
                    np.where(df[variable] < lower_limit, lower_limit, df[variable]))

data['LotArea']= winsorise(data, 'LotArea', data['LotArea'].quantile(0.95), data['LotArea'].quantile(0.05))
zero coding
以0取代資料集中數值小於0的資料值
建立一個常態分布的資料集
np.random.seed(29)

n = 200
x = np.random.randn(n) + 2
y = np.random.randn(n) * 2 + 4
z = np.random.randn(n) * 5 + 10

data = pd.DataFrame([x, y, z]).T
data.columns = ['x', 'y', 'z']

data.head()
/ |x | y | z
------------- | -------------
0 | 1.582518 | 6.903260 | 9.695655
1 | 2.706032 | 4.930279 | 14.363733
2 | 3.915985 | 4.688840 | 15.803355
3 | -0.141755 | 3.488652 | 17.403682
4 | 2.719057 | 2.388501 | 20.859069
data.min()
| x | -1.505401 |
|---|---|
| y | -0.901451 |
| z | -1.552986 |
| dtype: float64 |
data.loc[data['x'] < 0, 'x'] = 0
data.loc[data['y'] < 0, 'y'] = 0
data.loc[data['z'] < 0, 'z'] = 0

data.min()
| x | 0.0 |
|---|---|
| y | 0.0 |
| z | 0.0 |
| dtype: float64 |
資料分隔可以自動處理異常值,因為異常值會和其他較大或較小值一起被分隔到前後末端的區間,比較好的分隔方法是等寬離散化和決策樹分隔法
