在 Python 做數值資料運算分析,Pandas 這種神級工具不能不用。今天就來玩玩看吧!
在 Day08,我的 Dockerfile 已經介紹了玩轉今天的主題,所需要安裝的套件:
要利用上述的 Library 進行 Elasticsearch Document 分析,我們先 Import 它們。
import numpy as np
import pandas as pd
from elasticsearch import Elasticsearch
用昨天學到的查詢技巧,從 ES Cloud 拿 30 筆 2317 的盤後資料:
es = Elasticsearch(end_point, http_auth=(...))

s = Search(using=es, index="history-prices-python") \
    .query("match", stock_id="2317") \
    .sort({"date": {"order": "desc"}})
s = s[0:30]
response = s.execute()
計畫是把每個 filed (stock_id, date, open, high, low, close, volume) 各自建立成 ndarray 物件,稍後組成 Dataframe。
doc_fields = {}
for num, doc in enumerate(elastic_docs):
    source_data = doc["_source"]
    for key in source_data:
        try:
            doc_fields[key] = np.append(doc_fields[key], source_data[key])
        except KeyError:
            doc_fields[key] = np.array([source_data[key]])
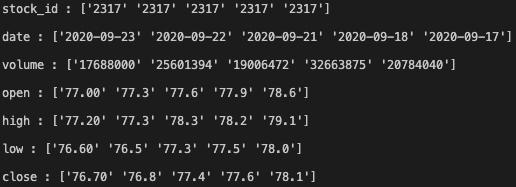
看看結果:
for key, val in doc_fields.items():
    print (key, ":", val)

看來不錯!
前面我把每一個 Field 轉換成了 NumPy ndarray 物件,並且組合成一個 dictionary 資料結構 (doc_fields),要建立成 Dataframe 只要將它丟進 Pandata.DataFrame 方法中,有沒有簡單到想哭!
elastic_df = pd.DataFrame(doc_fields)

print ('elastic_df:', type(elastic_df), "\n")
print (elastic_df) # print out the DF object's contents

明天就可以真正的來玩技術指標分析了… 漫漫長路
