今天來玩複雜一點的 Aggregation。
月/週 K 線是把同月份/週數的收盤資料做統計的動作,每根 K 棒代表當月/週的開盤、最高價、最低價、收盤價以及總成交量。要利用 Aggregation 來進行運算,我的第一步是來拆解 "Buckets"。用一個圖來分析: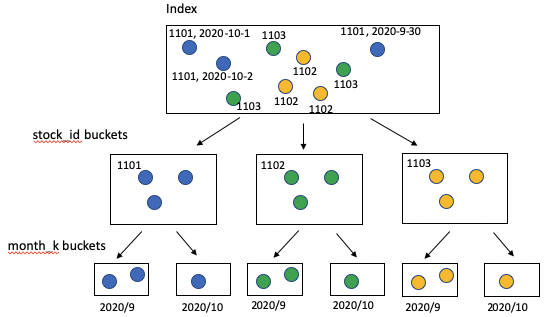
第一步,拆出 stock_id buckets:
GET /stock-history-prices-daily/_search
{
  "size":0,
  "aggs" : {
      "stock_id" : {
        "terms": {
          "field": "stock_id"
        }
      }
  }
}
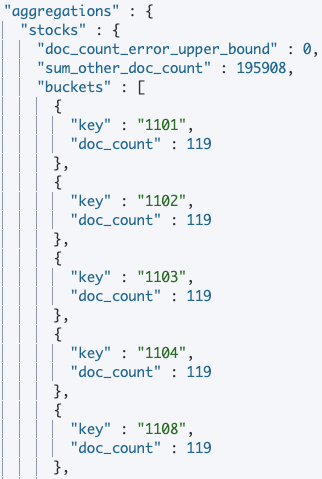
Aggregation 是可以 Nested 的!第二步,我要把每個 stock_id bucket 中的相同月份,再進行一次 aggregation。
GET /stock-history-prices-daily/_search
{
  "size":0,
  "aggs" : {
      "stock_id" : {
        "terms": {
          "field": "stock_id"
        },
        "aggs" : {
          "month_k": {
            "date_histogram": {
              "field": "date",
              "calendar_interval": "month"
            }
          }
        }
      }
  }
}
上面我使用了一個 date_histogram,參數設定只要指定以 month 為單位就可以,結果如下: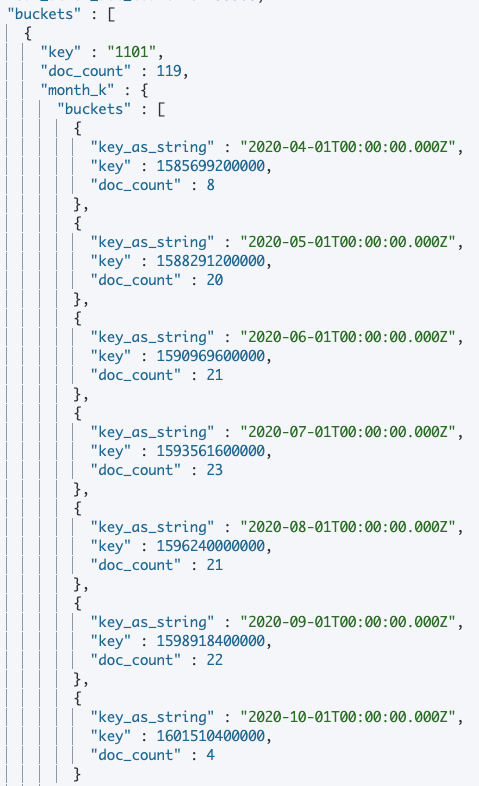
這就簡單了,再接一層 Aggregation,分別對 high/low 做 max,min aggs:
GET /stock-history-prices-daily/_search
{
  "size":0,
  "aggs" : {
      "stock_id" : {
        "terms": {
          ...
        },
        "aggs" : {
          "month_k": {
            ...
            },
            "aggs": {
              "high": {
                "max": {
                  "field": "high"
                }
              },
              "low": {
                "min": {
                  "field": "low"
                }
              }
            }
          }
        }
      }
  }
}
結果如下: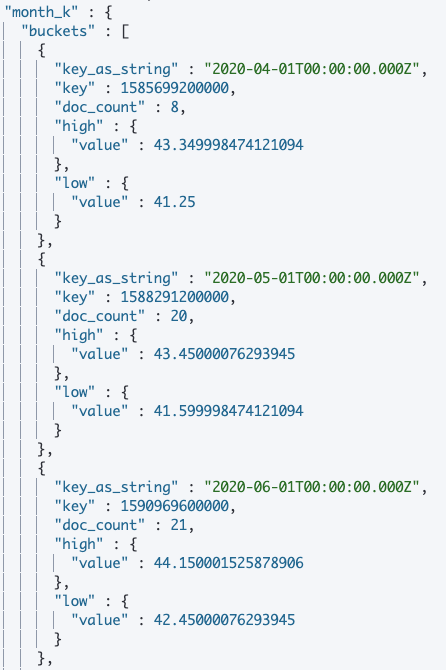
要找出當月份的 open (開盤)/close (收盤)價,我利用了 top_hit aggregation,並且進行了 sort,稍微麻煩一點:
GET /stock-history-prices-daily/_search
{
  "size":0,
  "aggs" : {
      "stock_id" : {
        ...
        },
        "aggs" : {
          "month_k": {
            ...
            },
            "aggs": {
              "high": {
                ...
              },
              "low": {
                ...
              },
              "open": {
                "top_hits": {
                  "size": 1,
                  "sort": [
                    {
                      "date": {
                         "order": "asc"
                      }
                    }
                  ]
                }
              },
              "close": {
                "top_hits": {
                  "size": 1,
                  "sort":
                  {
                      "date": {
                         "order": "desc"
                      }
                  }
                }
              }
...
}
結果如下: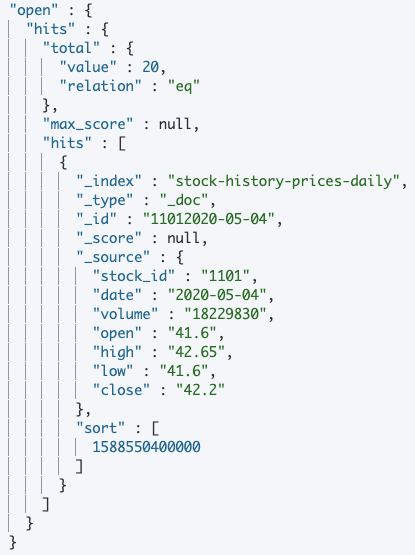
今天一口氣玩了好幾種 Aggregation,但在研究怎麼進行 Transform 成新的 Index 時卡關了。趕稿階段,沒太多探索時間,只好先放放… 最差不過就用 Python 解決嘛。 明天見啦~
