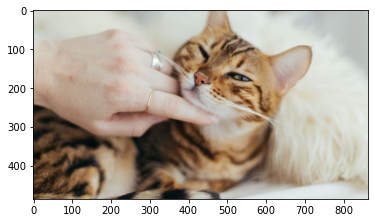
還是繼續請我們的貓貓助教來幫忙XDDDD
Day14_分離合併RGB直方圖_histogram_split_merge.ipynb
基本修圖技能學習完之後,
再來我們要來學一些比較進階會使用的修圖技巧囉!
def split_RGBThreeChannel(img):
    (B, G, R) = cv2.split(img) # 3 channel

    # make all zeros channel
    zeros = np.zeros(img.shape[:2], dtype = np.uint8)

    print("R channel:")
    show_img(merge_RGBThreeChannel(R=R, G=zeros, B=zeros))
    print("G channel:")
    show_img(merge_RGBThreeChannel(R=zeros, G=G, B=zeros))
    print("B channel:")
    show_img(merge_RGBThreeChannel(R=zeros, G=zeros, B=B))


    return R, G, B
分離RGB三通道使用 cv2.split 的方式,
有些時候我們在進階修圖會針對單一通道的顏色進行調整,
此時分離GRB三個通道就是非常重要的技術了!

def merge_RGBThreeChannel(R, G, B):
    img = cv2.merge([B, G, R])

    return img
使用 cv2.merge 這個函數,
通常我們在進階修圖中,會先分離RGB三通道,
進行各自顏色通道的調整後,
最後合併RGB三通道,完成我們的修圖。

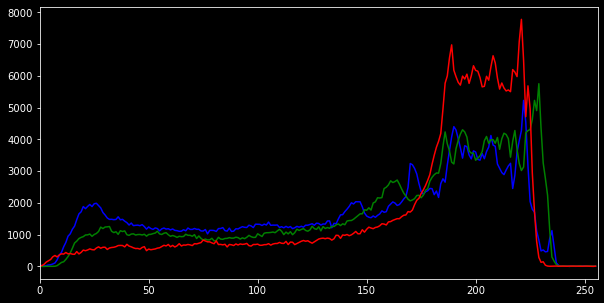
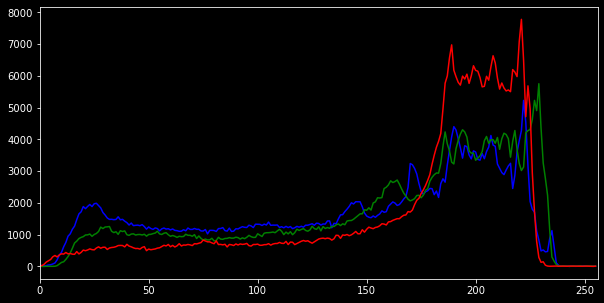
def show_histogram(img):
    # 畫出 RGB 三種顏色的分佈圖
    color = ('b','g','r')
    plt.style.use('dark_background')
    plt.figure(figsize=(10,5))
    for idx, color in enumerate(color):
        histogram = cv2.calcHist([img],[idx],None,[256],[0, 256])
        plt.plot(histogram, color = color)
        plt.xlim([0, 256])

    plt.show()
運用前面分離RGB三通道的技術,
我們可以針對RGB各通道各自畫出他們的直方圖。
在之後的進階修圖中,我們會觀察各顏色通道分佈的直方圖,
更細部的調整各顏色通道的數值。

https://blog.gtwang.org/programming/opencv-drawing-functions-tutorial/
https://blog.csdn.net/sunny2038/article/details/9080047
https://www.jianshu.com/p/9fd339f806a7
