這邊使用Golang來示範Agent
APM Server也是用golang寫的
package main

import (
    "fmt"
    "net/http"

    "go.elastic.co/apm/module/apmhttp"
)

func main() {
    mux := http.NewServeMux()

    mux.HandleFunc("/apm", func(w http.ResponseWriter, r *http.Request) {
        fmt.Fprint(w, "30day apm test", "\n")
    })

    http.ListenAndServe(":8080", apmhttp.Wrap(mux))
}
ELASTIC_APM_SERVICE_NAME=30day #Server Name方便辨識用
ELASTIC_APM_SERVER_URL=https://29701a126a544****30a979e4535a22a.apm.asia-east1.gcp.elastic-cloud.com:443 #APM Server位置
ELASTIC_APM_SECRET_TOKEN=CYBeuzHJtWFas8QFz1 #APM Server Token
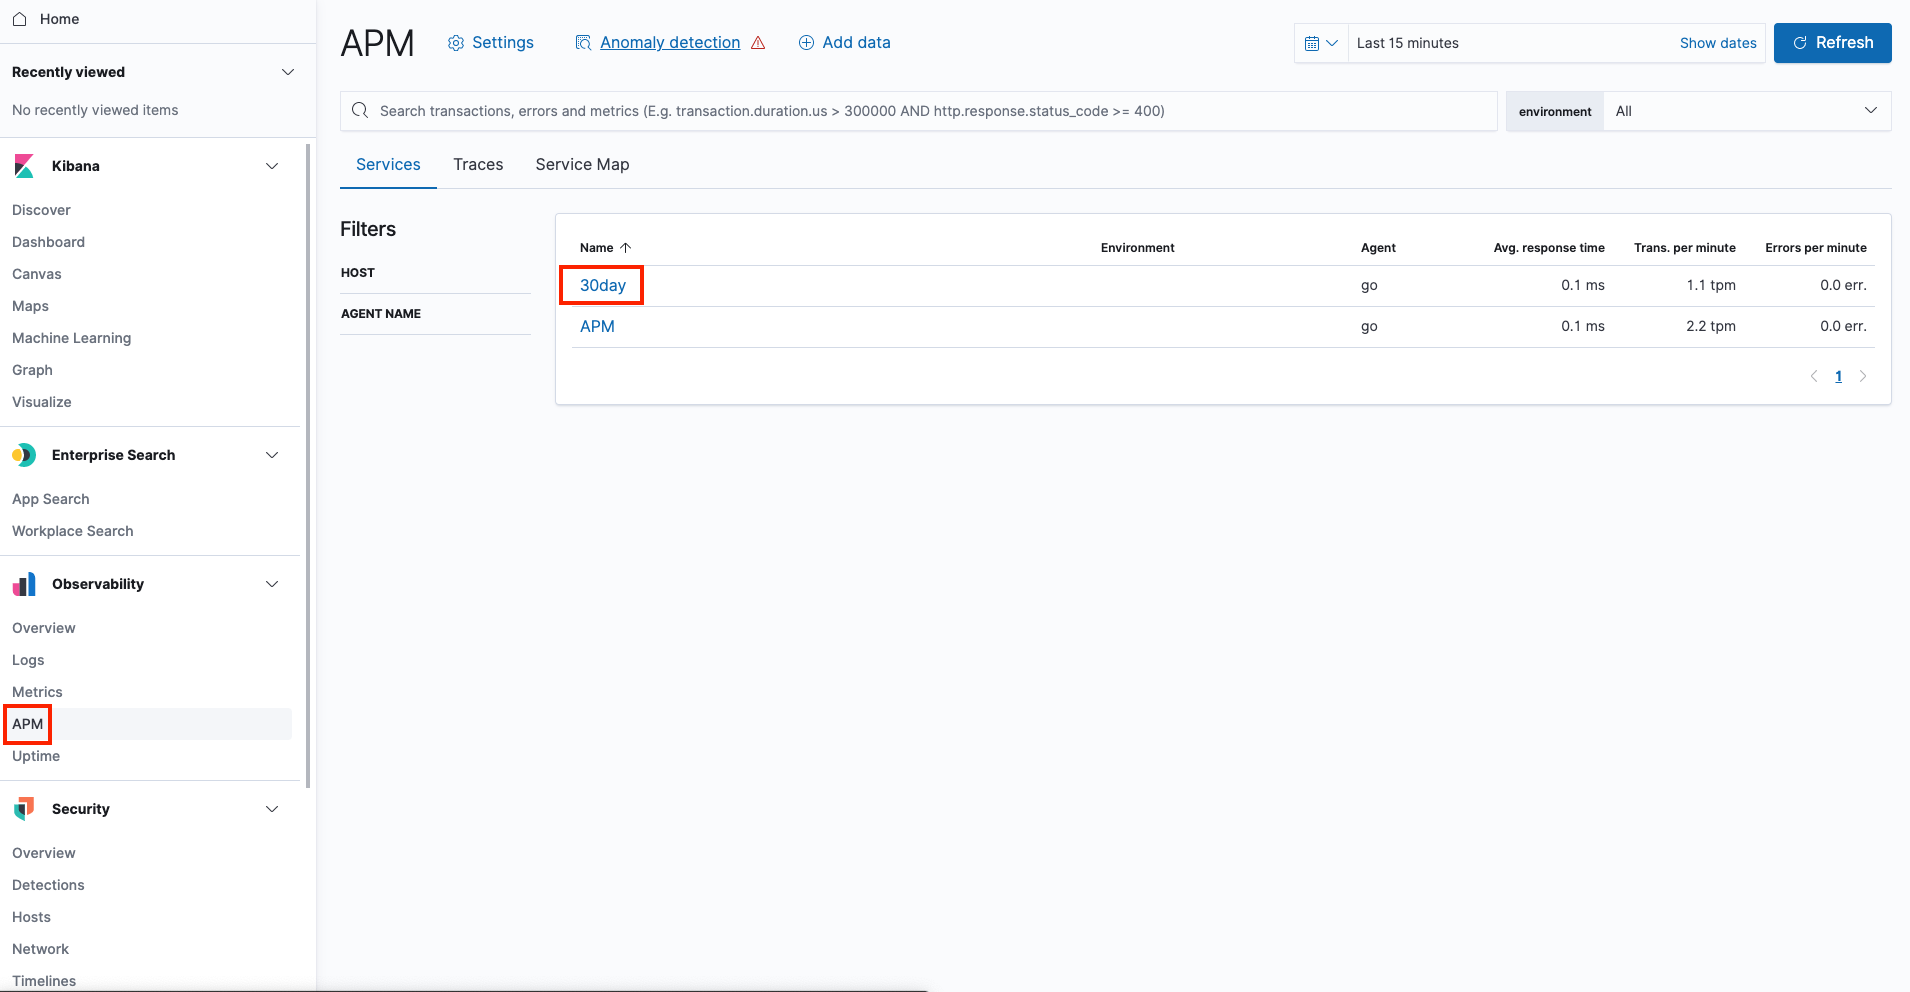
接著我們在遊覽器打http://localhost:8080/apm,接著就可以在Kibana APM裡面看到這些數據
透過圖表很方便的查看執行時間
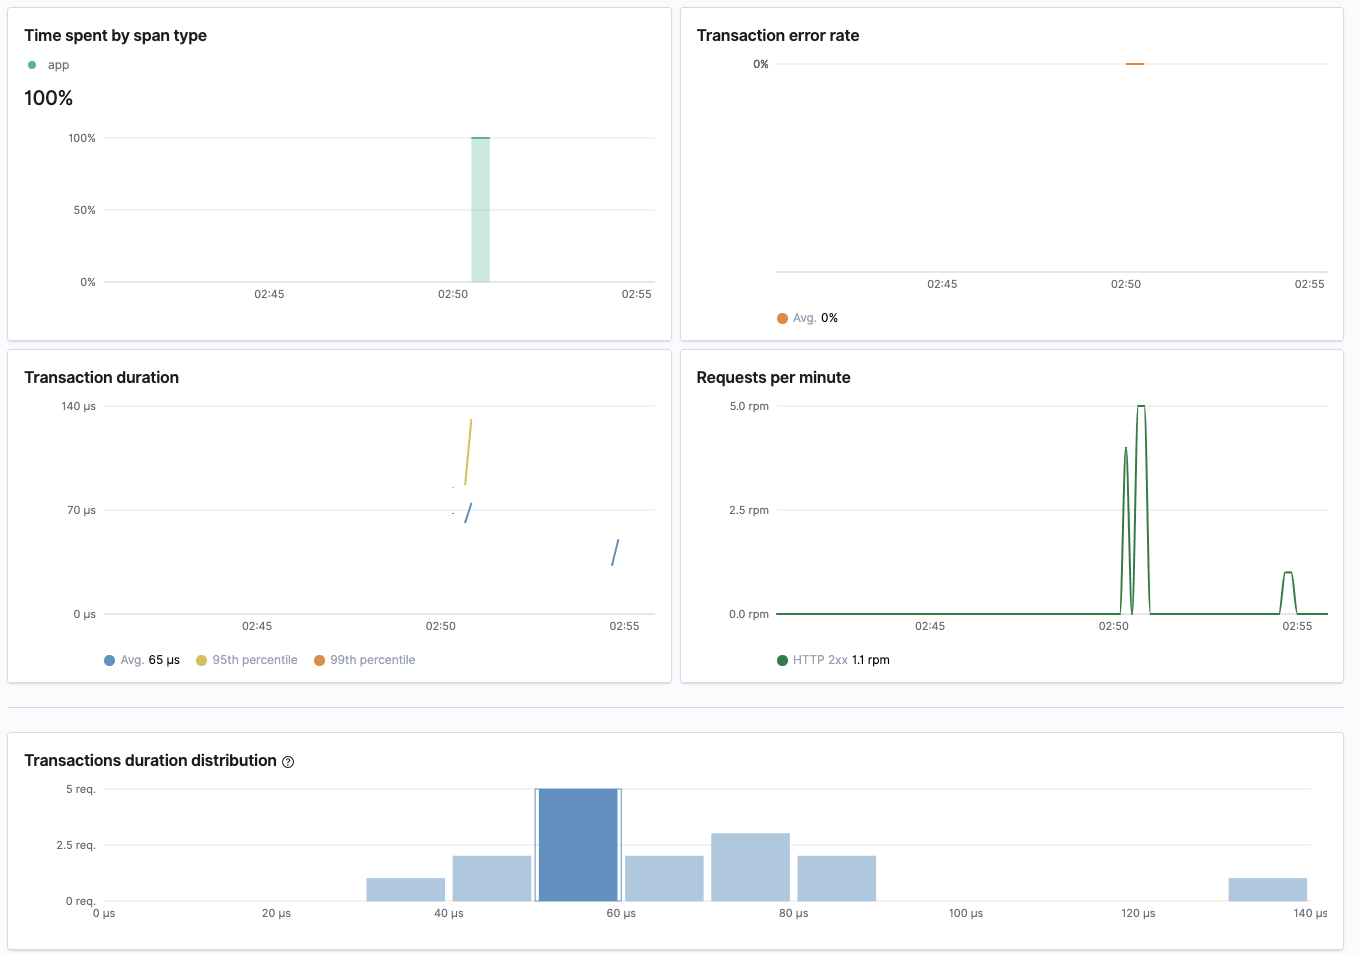
透過官方的module可以很方便的監控一些需要i/o的性能
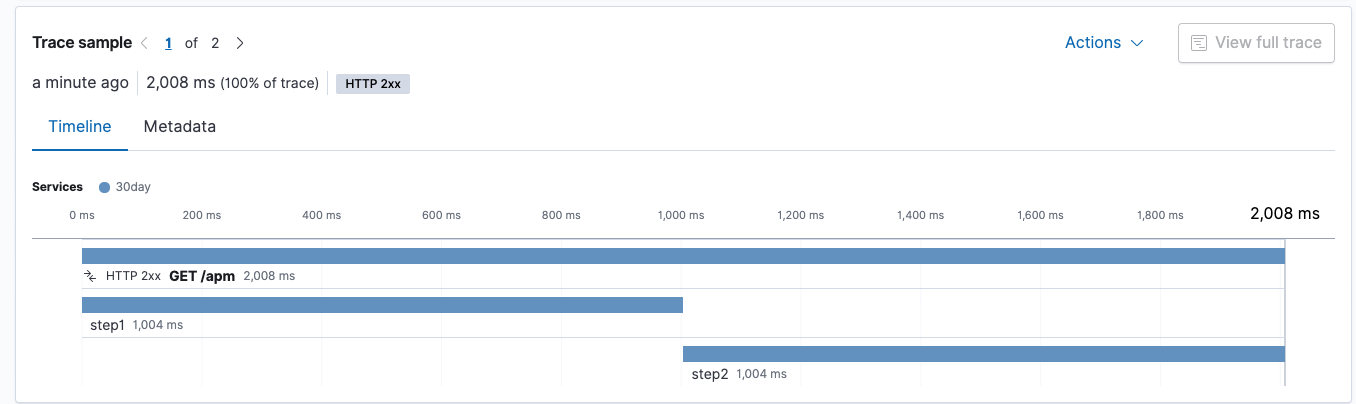
透過一些func也可以自定義一些片段的監控,針對每段區間的監控
package main

import (
    "fmt"
    "net/http"
    "time"

    "go.elastic.co/apm"
)

func main() {
    mux := http.NewServeMux()

    mux.HandleFunc("/apm", func(w http.ResponseWriter, r *http.Request) {
        tx := apm.DefaultTracer.StartTransaction("GET /apm", "request")

        defer tx.End()

        tx.Result = "HTTP 2xx"
        tx.Context.SetLabel("region", "us-east-1")

        step1(tx)
        step2(tx)

        fmt.Fprint(w, "30day apm test", "\n")

    })

    http.ListenAndServe(":8080", mux)
}

func step1(tx *apm.Transaction) {
    s := tx.StartSpan("step1", "step1", nil)
    defer s.End()

    time.Sleep(time.Second * 1)
}

func step2(tx *apm.Transaction) {
    s := tx.StartSpan("step2", "step2", nil)
    defer s.End()

    time.Sleep(time.Second * 1)
}
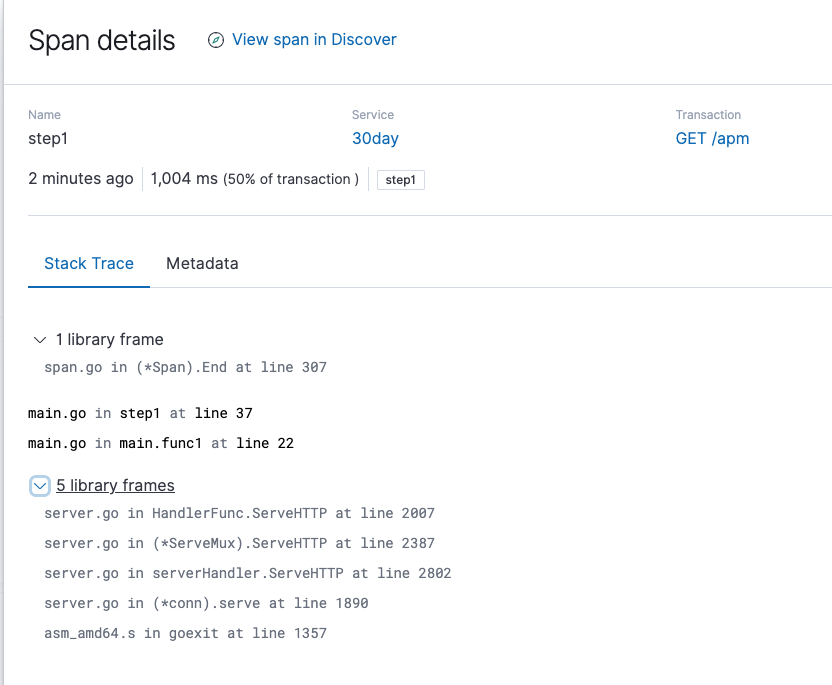
透過APM介面可以清楚的知道step1和step2花了多少時間,以及執行哪些東西


 iThome鐵人賽