一路戰了 23 天,感謝團長夫妻拉我入火坑,我已經看到了新的股票分析系統的無限可能性!到目前為止,我都把 Elastic Cloud + Elasticsearch 當作是我的雲端資料中心。但 Elasticsearch 應不止於此,所以接下來要來探索更多有關數據研究的方法,也就是 Aggregation。
Aggregation 簡單來說,就是 Elasticsearh「運算」與「統計」的工具,搭配優異的資料儲存與搜尋的特性,讓ES 擁有了數據分析的能力。要掌握 Aggregations,只要了解兩個主要的概念:
直接以一個範例說明:
GET /stock-history-prices-daily/_search
{
  "query" : {
    "match_all" : {}
  },
  "aggs" : { #1
    "data_size" : { #2
      "terms": {
          "field" : "stock_id" #3
      }
    }
  }
}
上面的 Aggregation 語法:
#1: 告訴 ES,接下來包含了 Aggregation DSL
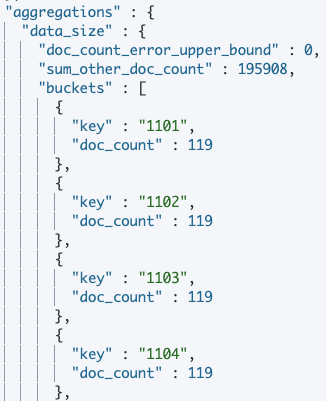
#2: 為這個 Aggregation 的目的取個名字,以我的例子而言,我想知道每檔股票歷史股價的資料筆數
#3: 定義 terms bucket,不同的 stock_id 各自的資料筆數
結果如下:
上面的例子,我們的資料目標是 Index 中的所有資料,這不是一個好的範例。透過 Query ,可以定義出資料的 "scope" ,再搭配 Aggregations 進行數據分析,才能發揮 ES 的強大威力。下面看一個例子:
GET /stock-history-prices-daily/_search
{
    "query" : {
      "bool": {
        "must": [
          {"match": {
            "date": "2020-10-08"
          }}
        ],
        "filter": {
          "script": {
            "script": {
              "lang": "painless",
              "source": "doc['close'].value < 100" ,
              "params": {}
            }
          }
        }
      }
    },
    "aggs" : {
      "prices_distribution" : {
        "histogram": {
          "field" : "close",
          "interval": 20
        }
      }
    }
}
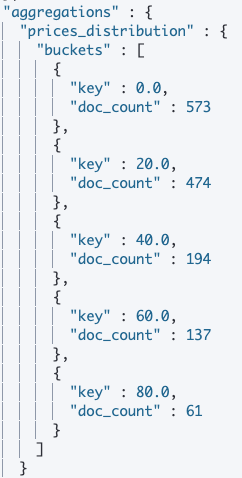
在這個 Case 中,我對 Scope 做了明確的定義:

今天初步的掌握了 Aggregation 的用法。但我能怎麼運用它在股票分析呢? 我還得花時間想一想,明天見啦!
