
我們可以利用 OpenShift 內建的 Prometheus 跟 AlertManager 來監控部署在 OpenShift 上面的應用程序或 OpenShift 平台外部的應用程序。底下範例都是透過系統管理者身份操作,你也可以給予一般使用者權限讓他們自行設定。
(1) 必須先在 ”openshift-monitoring“ 專案空間創建下列 ConfigMap 來開啟 “Technology Preview” 功能。
# cluster-monitoring-config.yaml
apiVersion: v1
kind: ConfigMap
metadata:
  name: cluster-monitoring-config
  namespace: openshift-monitoring
data:
  config.yaml: |
    techPreviewUserWorkload:
      enabled: true
一但該 ConfigMap 被建立,“rometheus-user-workload” Pod 也會被建立。
$ oc -n openshift-user-workload-monitoring get pod
NAME                                   READY   STATUS    RESTARTS   AGE
prometheus-operator-5857b6db84-mc5zx   1/1     Running   0          13m
prometheus-user-workload-0             5/5     Running   1          13m
prometheus-user-workload-1             5/5     Running   1          13m
(2) 建立一個測試用的應用程序及服務
apiVersion: v1
kind: Namespace
metadata:
  name: brandon
---
apiVersion: apps/v1
kind: Deployment
metadata:
  labels:
    app: prometheus-example-app
  name: prometheus-example-app
  namespace: brandon
spec:
  replicas: 1
  selector:
    matchLabels:
      app: prometheus-example-app
  template:
    metadata:
      labels:
        app: prometheus-example-app
    spec:
      containers:
      - image: quay.io/brancz/prometheus-example-app:v0.2.0
        imagePullPolicy: IfNotPresent
        name: prometheus-example-app
---
apiVersion: v1
kind: Service
metadata:
  labels:
    app: prometheus-example-app
  name: prometheus-example-app
  namespace: brandon
spec:
  ports:
  - port: 8080
    protocol: TCP
    targetPort: 8080
    name: web
  selector:
    app: prometheus-example-app
  type: ClusterIP
(3) 創建 ServiceMonitor 物件來吿知 Prometheus 該如何做 metrics collection。
apiVersion: monitoring.coreos.com/v1
kind: ServiceMonitor
metadata:
  labels:
    k8s-app: prometheus-example-monitor
  name: prometheus-example-monitor
  namespace: brandon
spec:
  endpoints:
  - interval: 30s
    port: web
    scheme: http
  selector:
    matchLabels:
      app: prometheus-example-app
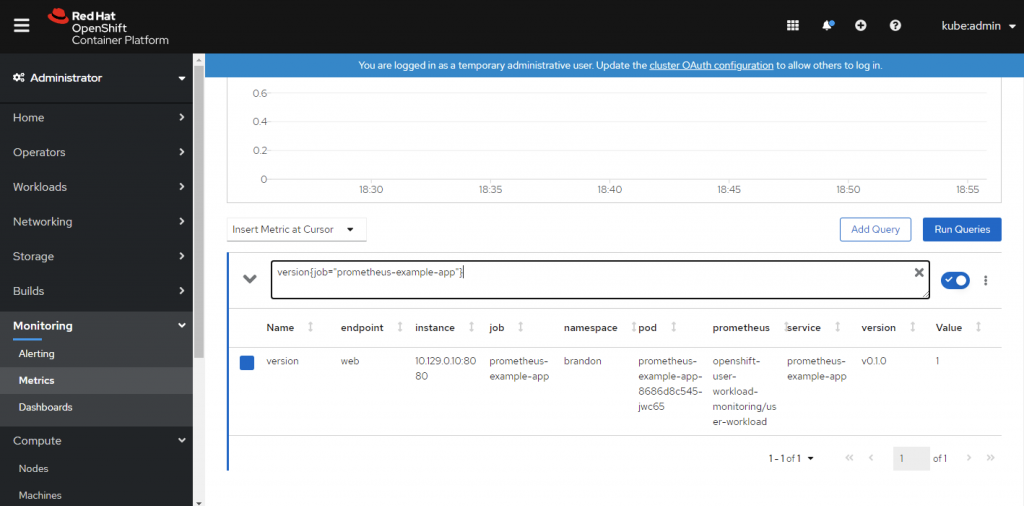
(4) 然後不久你就可以在 Web UI 確認是否能查詢到該應用程序的 metric。
(5) 還可以進一步建立 Alerts 規則
apiVersion: monitoring.coreos.com/v1
kind: PrometheusRule
metadata:
  name: example-alert
  namespace: ns1
spec:
  groups:
  - name: example
    rules:
    - alert: VersionAlert
      expr: version{job="prometheus-example-app"} == 0
跟監控內部程序很像,只是 Deployment 變成 EndPoint。你也必須先確認 OpenShift 節點到外部應用程序的防火牆有打開。
(1) 建立一個 Service 來代表你的外部服務,但這個 Service 不會透過 Selector 來找尋 Pods。
kind: "Service"
apiVersion: "v1"
metadata:
  name: quay-metrics-ports
  labels:
    k8s-app: quay-metrics-ports
    prometheus: kube-prometheus
spec:
  type: ExternalName
  externalName: {{ quay_ip }}
  ports:
    - name: quay-metrics
      port: 9092
      protocol: TCP
      targetPort: 9092
    - name: node-metrics
      port: 9100
      protocol: TCP
      targetPort: 9100
selector: {}
(2) 建立 EndPoint, 它可以讓 Proxy 和路由器(Route)將流量發送到應用程序的位置:
apiVersion: v1
kind: Endpoints
metadata:
  name: quay-metrics-ports
  labels:
    k8s-app: quay-metrics-ports
    prometheus: kube-prometheus
  namespace: brandon
subsets:
- addresses:
  - ip: {{ quay_ip }}
    targetRef:
      kind: Node
      name: quay-uat
  ports:
  - name: quay-metrics
    port: 9092
    protocol: TCP
  - name: node-metrics
    port: 9100
    protocol: TCP
(3) 一樣建立 ServiceMonitor 吿知 Prometheus 該如何做 metrics collection。
apiVersion: monitoring.coreos.com/v1
kind: ServiceMonitor
metadata:
  generation: 1
  name: quay
  labels:
    k8s-app: quay-metrics
    prometheus: kube-prometheus
spec:
  jobLabel: k8s-app
  selector:
    matchLabels:
      k8s-app: quay-{{ cluster_region }}-{{ cluster_type }}-metrics-ports
  namespaceSelector:
    matchNames:
      - openshift-monitoring
  endpoints:
  - port: quay-metrics
    interval: 30s
    path: /metrics
    scheme: http
    honorLabels: true
  - port: node-metrics
    interval: 30s
    path: /metrics
    scheme: http
    honorLabels: true
(4) 建立 Alerts 規則
apiVersion: monitoring.coreos.com/v1
kind: PrometheusRule
metadata:
  labels:
    prometheus: k8s
    role: alert-rules
  name: quay-rules
spec:
  groups:
  - name: quay.rules
    rules:
    - expr: quay_repository_count
      record: quay_repository_count
    - expr: |
        100 - 100 * (node_filesystem_avail_bytes{mountpoint="/opt"} / node_filesystem_size_bytes{mountpoint="/opt"})
      record: quay_node_data_disk_usage
    - expr: |
        100 - 100 * (node_filesystem_avail_bytes{device="rootfs",mountpoint="/",job="quay"} / node_filesystem_size_bytes{device="rootfs",mountpoint="/",job="quay"})
      record: quay_node_root_disk_usage
  - name: quay-alert.rules
    rules:
    - alert: QuayDataDiskRunningFull
      annotations:
        message: 'Quay data volume usage on target {{ $labels.instance }} at {{ $value }}%'
      expr: |
        100 - 100 * (node_filesystem_avail_bytes{mountpoint="/opt"} / node_filesystem_size_bytes{mountpoint="/opt"}) > 85
      for: 15m
      labels:
        severity: warning
    - alert: QuayRootDiskRunningFull
      annotations:
        message: 'Quay root volume usage on target {{ $labels.instance }} at {{ $value }}%'
      expr: |
        100 - 100 * (node_filesystem_avail_bytes{device="rootfs",mountpoint="/",job="quay"} / node_filesystem_size_bytes{device="rootfs",mountpoint="/",job="quay"}) > 85
      for: 15m
      labels:
        severity: warning
    - alert: HighSystemLoad
      annotations:
        message: 'Quay has high system load on target {{ $labels.instance }} at {{ $value }} for past 30 minutes'
      expr: |
        node_load15{service=~"quay"} > 2
      for: 30m
      labels:
        severity: warning
越來愈多人選擇用 Prometheus 來監控程序。透過 OpenShift 內部整合好的 Prometheus 跟 AlertManager,真的可以省下很多功夫。
