
在前篇文章中,我已經將 Grafana Operator 部署到 "brandon" 的專案空間。這篇文章將介紹如何透過 Grafana Operator 部署另一個 Grafana 並為應用程序客製化自己的 Grafana Dashboard。
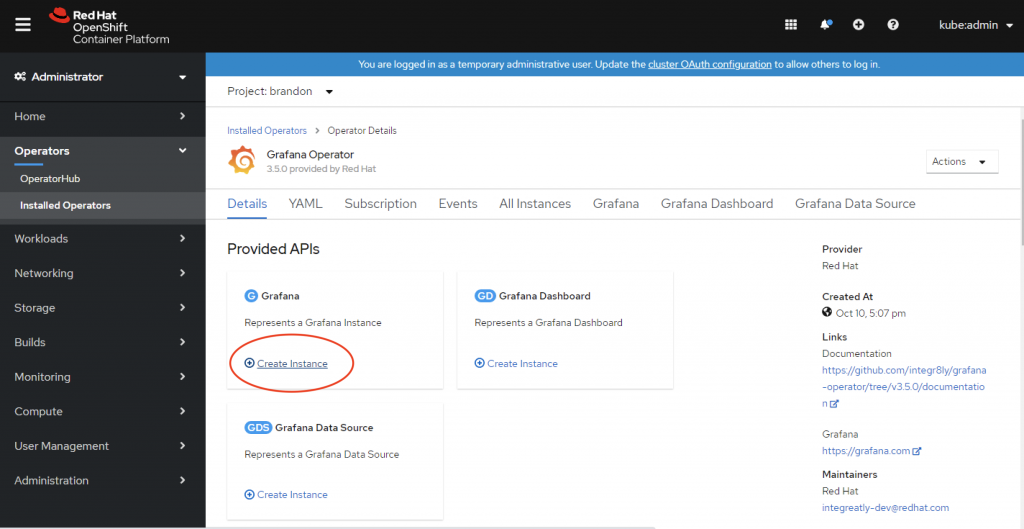
從 “Installed Operators” 頁面, 選擇 “Grafana Operator,然後再點選建立新的 Grafana instance 。
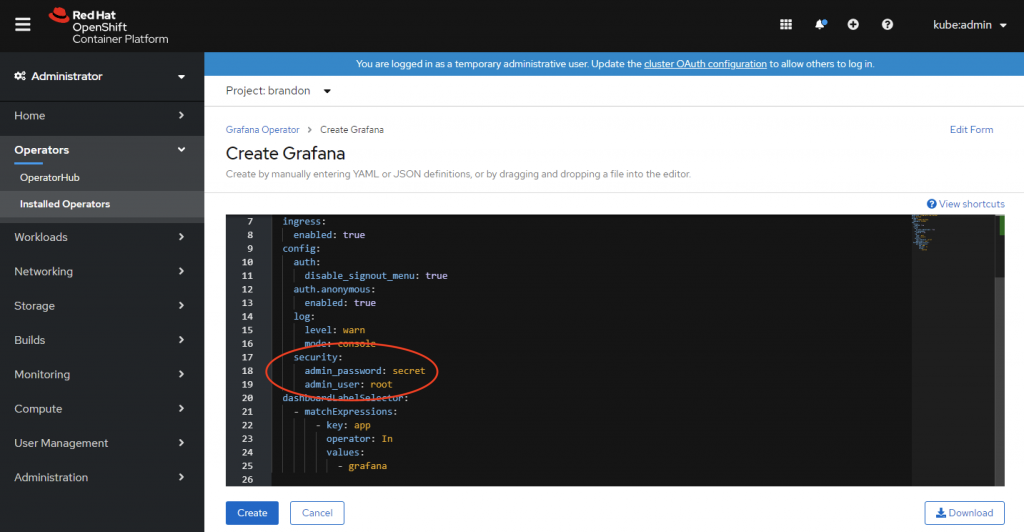
建立新的 Grafana instance 過程中,可以修改 YAML 檔案中管理者的 username 跟 password 。然後按下 "Create"。
確定 Grafana Pod 的狀態是 ”running“。
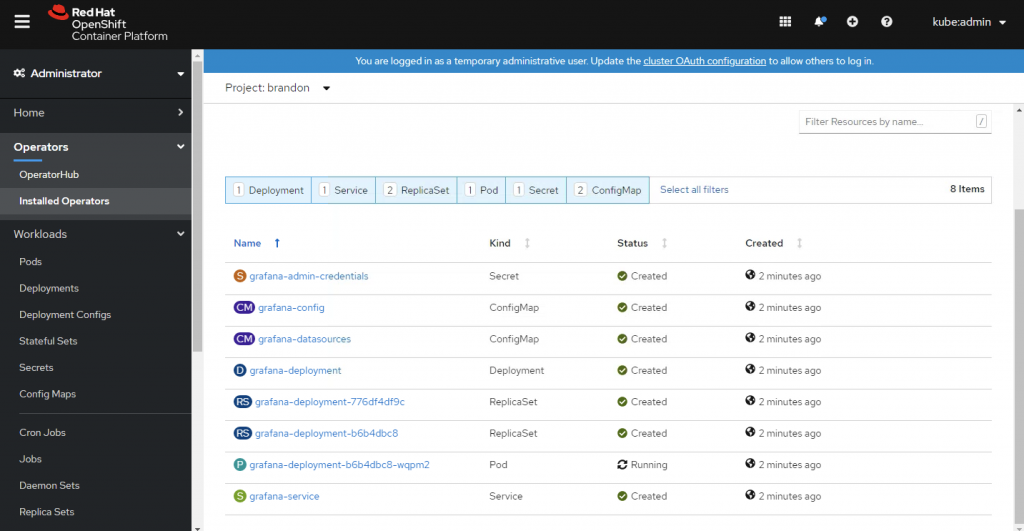
在建立 Grafana instance 時, “grafana-serviceaccount” service account 也會被建立。 我們必須 assign "cluster-monitoring-view" role 給這個 service account,讓它有權限讀取 Prometheus 的資源。
$ oc project brandon
$ oc adm policy add-cluster-role-to-user cluster-monitoring-view -z grafana-serviceaccount
先取得 “grafana-serviceaccount” service account 的 bearer token。
$ oc serviceaccounts get-token grafana-serviceaccount -n brandon
在 Grafana Operator 的頁面,點取建立新的 ”Grafana Data Source“,然後將下列 YAML貼上,並把 ${BEARER_TOKEN} 更改為剛剛取得的bearer token,然後按下 “Create“。
apiVersion: integreatly.org/v1alpha1
kind: GrafanaDataSource
metadata:
  name: prometheus-grafanadatasource
spec:
  datasources:
    - access: proxy
      editable: true
      isDefault: true
      jsonData:
        httpHeaderName1: 'Authorization'
        timeInterval: 5s
        tlsSkipVerify: true
      name: Prometheus
      secureJsonData:
        httpHeaderValue1: 'Bearer ${BEARER_TOKEN}'
      type: prometheus
      url: 'https://thanos-querier.openshift-monitoring.svc.cluster.local:9091'
  name: prometheus-grafanadatasource.yaml
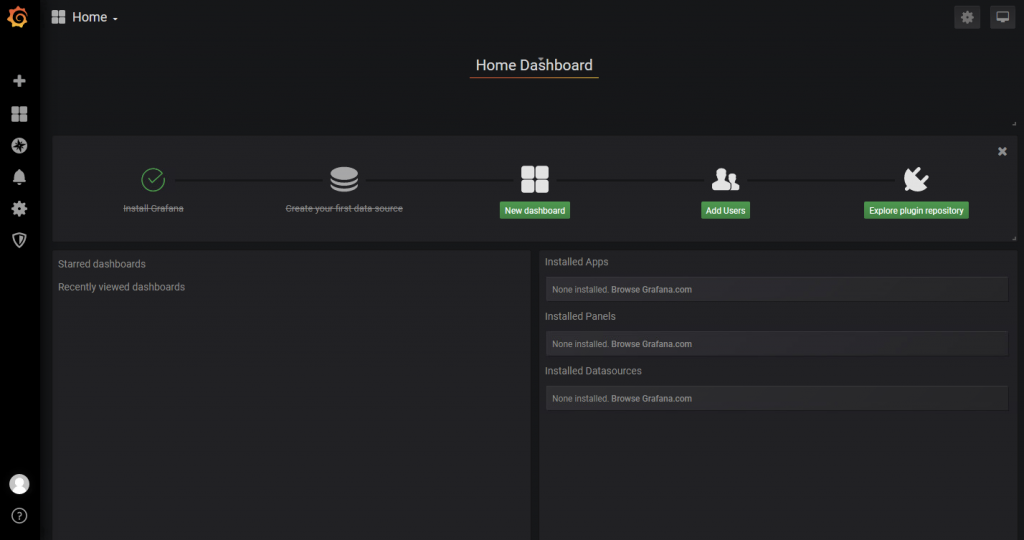
從 Networking -> Routes 頁面確認 Grafana URL,並利用之前設定的管理者帳號跟密碼登入。
確定我們可以查詢 prometheus 的 metrics。
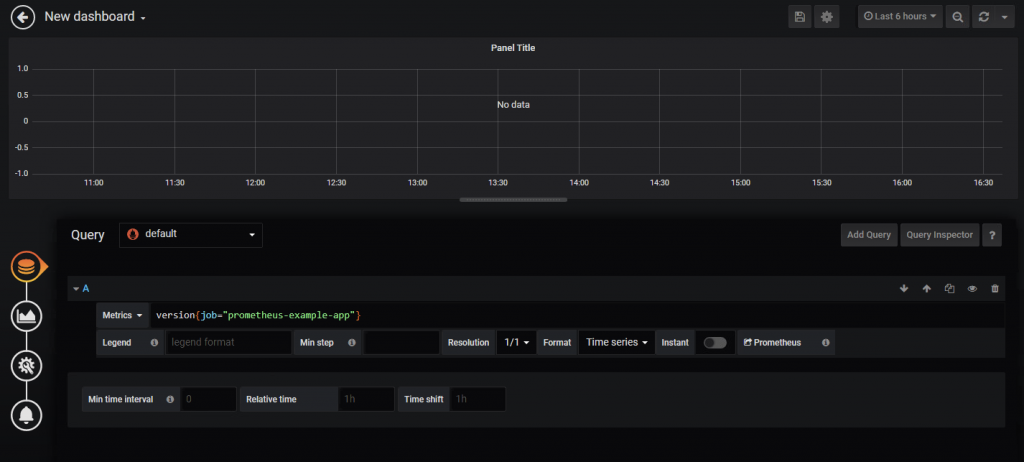
你可以手動從 Grafana 直接建立或建立新的 "GrafanaDashboard".
在 Grafana Operator 的頁面,點取建立新 Grafana Dashboard,並將下列 YAML 檔貼上,然後按下 “Create“。
apiVersion: integreatly.org/v1alpha1
kind: GrafanaDashboard
metadata:
  labels:
    app: grafana
  name: simple-dashboard
  namespace: brandon
spec:
  json: |
    {
      "annotations": {
        "list": [
          {
            "builtIn": 1,
            "datasource": "-- Grafana --",
            "enable": true,
            "hide": true,
            "iconColor": "rgba(0, 211, 255, 1)",
            "name": "Annotations & Alerts",
            "type": "dashboard"
          }
        ]
      },
      "editable": true,
      "gnetId": null,
      "graphTooltip": 0,
      "id": 6,
      "links": [],
      "panels": [
        {
          "cacheTimeout": null,
          "colorBackground": false,
          "colorValue": false,
          "colors": [
            "#299c46",
            "rgba(237, 129, 40, 0.89)",
            "#d44a3a"
          ],
          "datasource": null,
          "format": "none",
          "gauge": {
            "maxValue": 100,
            "minValue": 0,
            "show": false,
            "thresholdLabels": false,
            "thresholdMarkers": true
          },
          "gridPos": {
            "h": 9,
            "w": 12,
            "x": 0,
            "y": 0
          },
          "id": 2,
          "interval": null,
          "links": [],
          "mappingType": 1,
          "mappingTypes": [
            {
              "name": "value to text",
              "value": 1
            },
            {
              "name": "range to text",
              "value": 2
            }
          ],
          "maxDataPoints": 100,
          "nullPointMode": "connected",
          "nullText": null,
          "options": {},
          "postfix": "",
          "postfixFontSize": "50%",
          "prefix": "",
          "prefixFontSize": "50%",
          "rangeMaps": [
            {
              "from": "null",
              "text": "N/A",
              "to": "null"
            }
          ],
          "sparkline": {
            "fillColor": "rgba(31, 118, 189, 0.18)",
            "full": false,
            "lineColor": "rgb(31, 120, 193)",
            "show": false,
            "ymax": null,
            "ymin": null
          },
          "tableColumn": "",
          "targets": [
            {
              "expr": "version{job=\"prometheus-example-app\"}",
              "refId": "A"
            }
          ],
          "thresholds": "",
          "timeFrom": null,
          "timeShift": null,
          "title": "App Version",
          "type": "singlestat",
          "valueFontSize": "80%",
          "valueMaps": [
            {
              "op": "=",
              "text": "N/A",
              "value": "null"
            }
          ],
          "valueName": "avg"
        }
      ],
      "schemaVersion": 21,
      "style": "dark",
      "tags": [],
      "templating": {
        "list": []
      },
      "time": {
        "from": "now-6h",
        "to": "now"
      },
      "timepicker": {},
      "timezone": "",
      "title": "Example App Dashboard",
      "uid": "DAs6rtcGz",
      "version": 1
    }
  name: simple-dashboard.json
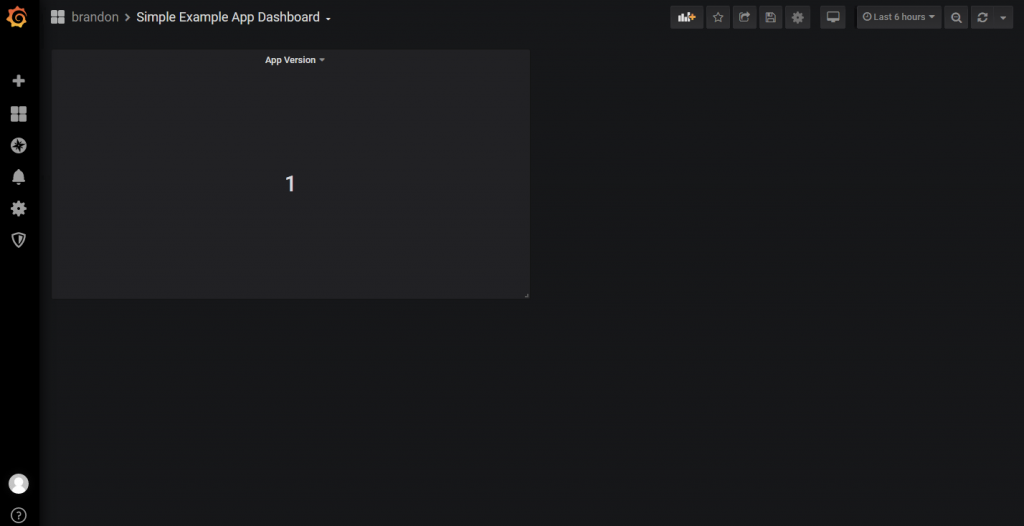
回到 Grafana Web UI,確定新的 Dashboard 有被建立。
https://www.redhat.com/en/blog/custom-grafana-dashboards-red-hat-openshift-container-platform-4

 iThome鐵人賽