再來是辦公室表單的處理,
假設有些表單只有圖像或是只有紙本,
想要匯入成Excel檔案時,
我們就可以使用前面所使用的OCR程式來幫助進行轉換。
首先,可能有人會問為甚麼不使用OPEN-CV來解析表格的框線,
然後使用每一格送入進行辨識?
表格不一定都有框線,使用pytessert會有辨識率不佳的情況,
如果有50格的表格,使用google client vision成本就大幅提升了50倍(每月前1000張免費,之後每1000張大約30元台幣)。
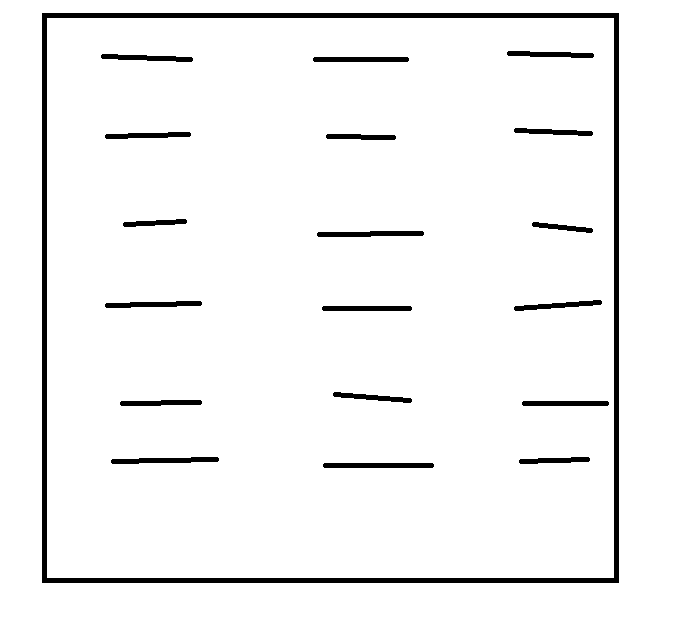
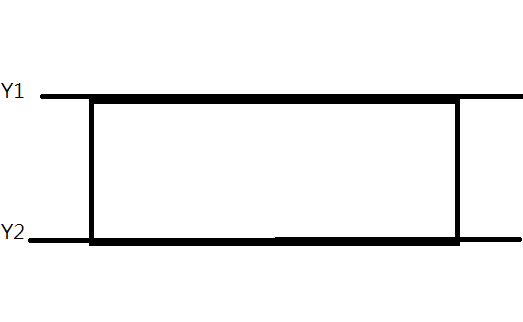
這是我預想中的表格樣式,每一條線代表一個字串。
from google.cloud import vision
import io
import os
credential_path = "cred.json"
os.environ['GOOGLE_APPLICATION_CREDENTIALS'] = credential_path
client = vision.ImageAnnotatorClient()
with io.open('table.png', 'rb') as image_file:
content = image_file.read()
image = vision.Image(content=content)
response = client.text_detection(image=image)
texts = response.text_annotations
print('Texts:')
Xarray=[]
Yarray=[]
TextArray=[]
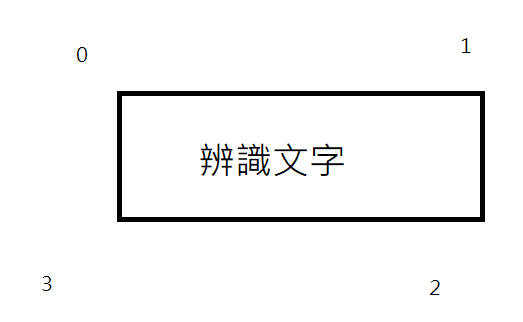
for text in texts[1:]:
xy0=(text.bounding_poly.vertices[0].x, text.bounding_poly.vertices[0].y)
xy1=(text.bounding_poly.vertices[1].x, text.bounding_poly.vertices[1].y)
xy2=(text.bounding_poly.vertices[2].x, text.bounding_poly.vertices[2].y)
xy3=(text.bounding_poly.vertices[3].x, text.bounding_poly.vertices[3].y)
print(f"{xy0}{xy1}{xy2}{xy3} {text.description}")
Yarray.append([text.bounding_poly.vertices[0].y,text.bounding_poly.vertices[2].y])
Xarray.append([text.bounding_poly.vertices[0].x ,text.bounding_poly.vertices[1].x])
TextArray.append(text.description)
處理表格,我就沒有使用第0個的集合元素,
而是後面的元素文字及座標。
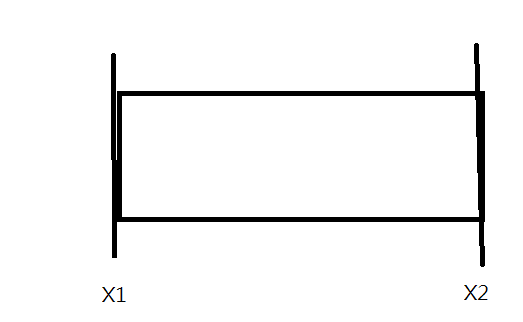
每個文字取兩個X及兩個Y座標為特徵:
採用Kmeans演算法來將字串以Y座標分群,並以silhouette_score找出最將分群數
(假設資料表格列數不超過60,超過的話,可以自行調整60的數值 )
import numpy as np
from sklearn.metrics import silhouette_score
from sklearn.cluster import KMeans
from scipy.signal import find_peaks

Yarray_X=np.array(Yarray)
silhouette_avg = []

for i in range(2,60):
    try:
        kmeans_fit = KMeans(n_clusters = i,max_iter=500).fit(Yarray_X)
        silhouette_avg.append(silhouette_score(Yarray_X, kmeans_fit.labels_))
    except:
        pass

best_cluster_number,peak_heightsDict=find_peaks(silhouette_avg,height=0.7)

RowNumCategories=best_cluster_number[0]+2
#使用最佳分群數來重新分群
herekmeans = KMeans(n_clusters=RowNumCategories,max_iter=500).fit(Yarray_X)

RowSerialCount=1
row_dict={}
RowactualArray=[]

#這裡是將Y座標得到的分群轉換成未來寫入excel時的第幾個row。
for ele in herekmeans.labels_:
    if ele not in row_dict:
        row_dict[ele]=RowSerialCount
        RowSerialCount+=1

    RowactualArray.append(row_dict[ele])
X座標,欄位上的轉換:
(可自行調整欄位20的數值,但是如果超過26,後續轉換到excel字母時,需要再自行調整)
X=np.array(Xarray)

TableColumn=20
silhouette_avg = []
for i in range(2,TableColumn):
    kmeans_fit = KMeans(n_clusters = i,max_iter=500).fit(X)
    silhouette_avg.append(silhouette_score(X, kmeans_fit.labels_))

category_count  =  silhouette_avg.index(max(silhouette_avg))+2

print("最佳column分群數::")
print(category_count)

kmeans = KMeans(n_clusters=category_count,max_iter=500).fit(X)
文字X座標,一樣使用最佳分群數來分群
cStarRay=[]
for center in kmeans.cluster_centers_:
    cStar=(center[0]+center[1])/2
    # print(center)
    # print(int(cStar))
    cStarRay.append(int(cStar))

ReSortStarRay=sorted(cStarRay)
Stardict={}
for star in cStarRay:
    StarIndex = cStarRay.index(star)
    ReStarIndex = ReSortStarRay.index(star)
    Stardict[StarIndex]=ReStarIndex

actualXArray=[]
for ele in kmeans.labels_:
    actualXArray.append(Stardict[ele])

Column_actualArray  = np.array(actualXArray)
使用kmeans群心來重新排序X座標欄位
我們將文字內容、欄位分群結果、列數分群結果用zip打包
ToExcelZip=zip(TextArray,Column_actualArray,RowactualArray)
將文字寫入EXcel,使用openpyxl套件:
安裝
pip install openpyxl
使用
import openpyxl
wb=openpyxl.load_workbook("./template.xlsx")
ws=wb["工作表1"]
counts={}
for i in range(category_count):
counts[chr(65+i)]=1
for i in enumerate(ToExcelZip):
# print(i)
column=chr(65+i[1][1])
# print(column)
ws_column=column+str(i[1][2])
if ws[ws_column].value == None:
ws[ws_column]=i[1][0]
else:
ws[ws_column]=ws[ws_column].value+" "+i[1][0]
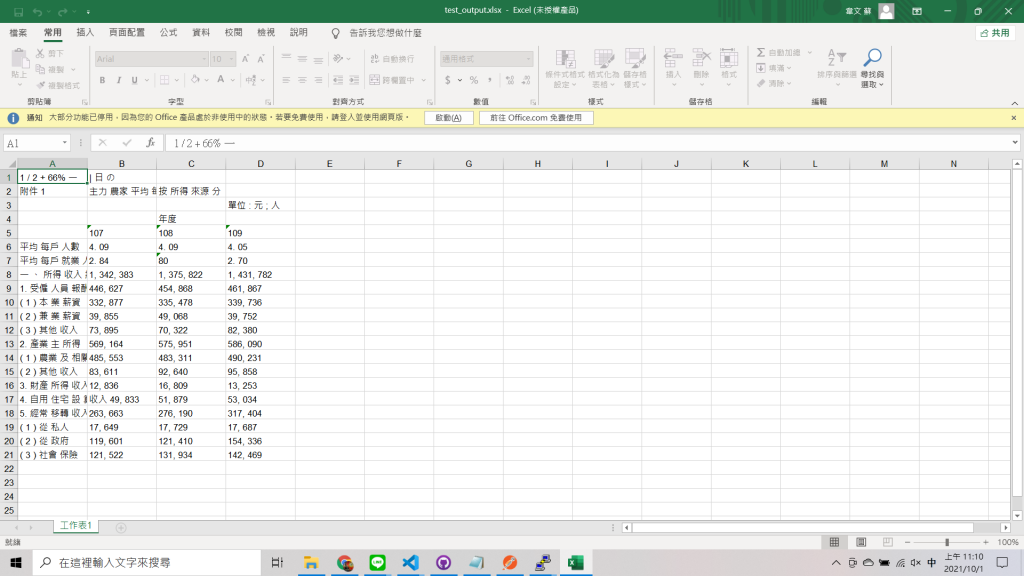
wb.save("test_output.xlsx")
依照分群結果來寫入特定Excel欄位。
這是從農委會找到的 主力農家平均每戶所得按所得來源分 表格: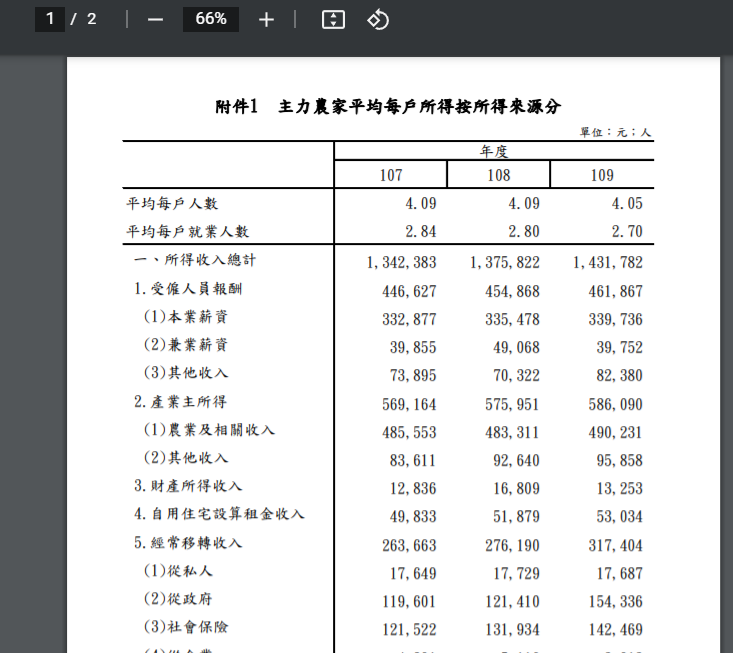
進行截圖及執行程式看結果: