Machine learning常用到的一個diabetes 糖尿病資料集,Pima印第安人數據起源於1980年代,目前在機器學習領域還是廣為使用,在Kaggle上的運用範例就超過了1700個以上。
我們今天就來探究一下這個資料集。
<資料集來源>:Kaggle download here
from National Institute of Diabetes and Digestive and Kidney Diseases; Includes cost data (donated by Peter Turney)
<資料集說明>來源
768筆記錄。 9個欄位:8 特徵 1 target
This dataset describes the medical records for Pima Indians and whether or not each patient will have an onset of diabetes within five years.
Fields description follow:
< 變數選擇 > 8項input variables
Diabetes Pedigree Function 族譜系數 DPF,此一參數是他們自創的。文中有解釋計算方式,有興趣的請自行參閱。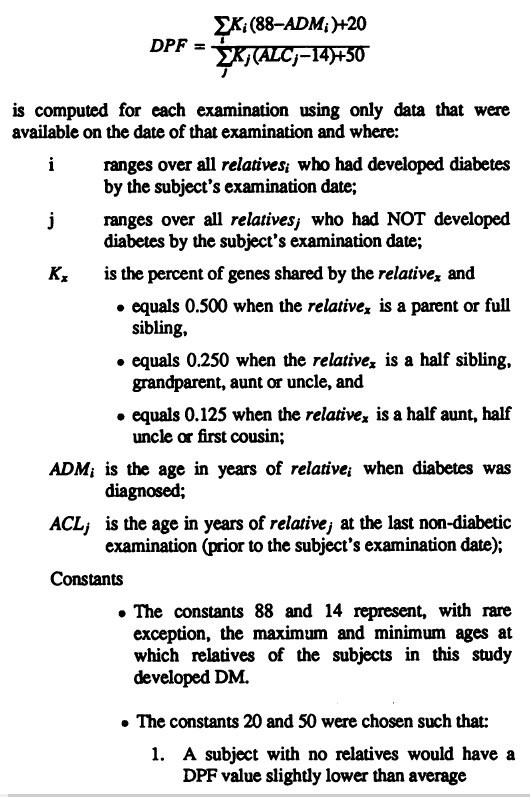
大致意思是:如果家族中得病的人數較多,而這些人發病的年齡比較早,或者親等關係比較近的,這個DPF數值就會比較高。反之,則DPF數值比較低。
公式大略是以”親屬發病年齡”、”親等關係比例”…等參數加權計算出來的。
< Case selection >案例選擇,必須全部符合以下四項標準:
< 資料集表達什麼? >
2014年有篇文章 The Open Diabetes Journal, 2014, 7, 5-13 特討分析這筆Pima Dataset 得出如下結論:
我們今天的重點,就是來分析此一資料集,看看能否視覺化,重現上述的相關性,並做modeling、prediction預測
Step1. Read dataset / Explore
''' Step1. Load dataset / explore '''
df = pd.read_csv('pimaDM.csv')
df.isnull().sum()
df.describe()
df.info()
df.head()
df.value_counts()
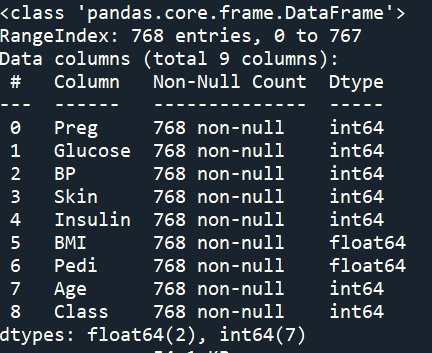
Step 2. data visulalize 畫個Box圖 觀察離散程度
df0 無病組 df1 有病組 把2組畫在一起
''' Step 2. data visulalize
   畫個Box圖 觀察離散程度   '''
# df0 無病組  df1 有病組
df0 = df[df['Class'] == 0 ]
df1 = df[df['Class'] == 1 ]

# 把2組畫在一起
fig,axes = plt.subplots(1,2,sharey=True,figsize=(10,6))

axes[0].set_title('Healthy')
axes[1].set_title('DM')

fig.autofmt_xdate(rotation=45)
sns.boxplot(data=df0,ax=axes[0])
sns.boxplot(data=df1,ax=axes[1])

fig.savefig('DM_orig_box.jpg')
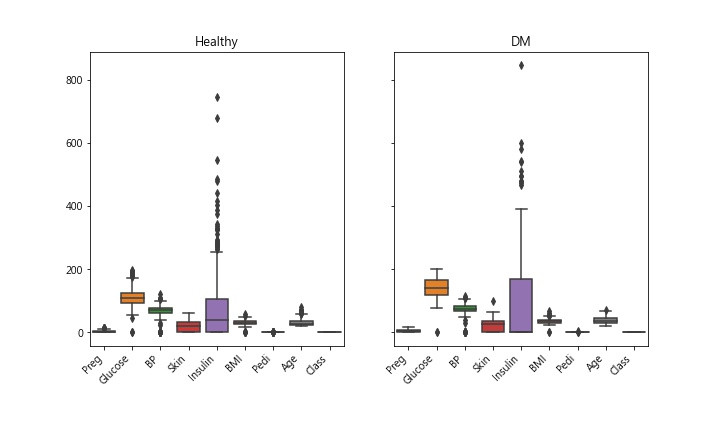
Insulin此特徵數據,離群值似乎很多。算一下統計數據看看
''' Step 3. 統計數據 '''
pd.set_option('display.max_columns',None)  # 顯示所有columns
print(df.describe())
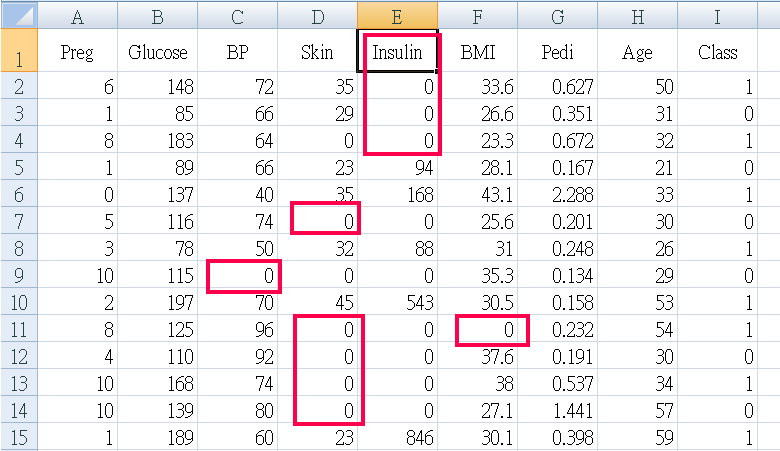
天啊! 出現了很多不合理數據,怎麼說? BP血壓是0 ? 皮膚厚度是0 ? 不可能是0,應該是當時沒做測量,就隨意給個0當數字。
Step 4. 不合理的異常數據處理
血壓、皮膚厚度...多項多筆數據=0 明顯不合理,將五項特徵 Glucose BP Skin Insulin BMI 數據=0 剔除 ( ps. 原本還包括異常值大於95percentile者,但是資料只剩下三分之一了)
''' Step 4. 不合理的異常數據處理
    血壓、皮膚厚度...多項多筆數據=0 明顯不合理
    將五項特徵 Glucose BP Skin Insulin BMI
    數據=0 and >95percentile者剔除
'''
df_Trim = df      # 處理dataframe
# 95 percentile
#Insulin_q95  = df_Trim['Insulin'].quantile(.95)
#print(f'Insulin 95 percentlie: {Insulin_q95}')
#idxNames = df_Trim[ df_Trim['Insulin'] >= Insulin_q95 ].index
#df_Trim = df.drop(idxNames)
# = 0 者
idxNames = df_Trim[ df_Trim['Insulin']<=0 ].index
df_Trim = df_Trim.drop(idxNames)
print(df_Trim.info())
print(df_Trim)
#---以下略---
Step 5. 剩下的資料,再畫一次 boxplot
剔除 0 & >95percentile者,剩下 273筆記錄 768筆 剩下 35.5% 可用, 如果只剔除 0者,則剩下 392筆記錄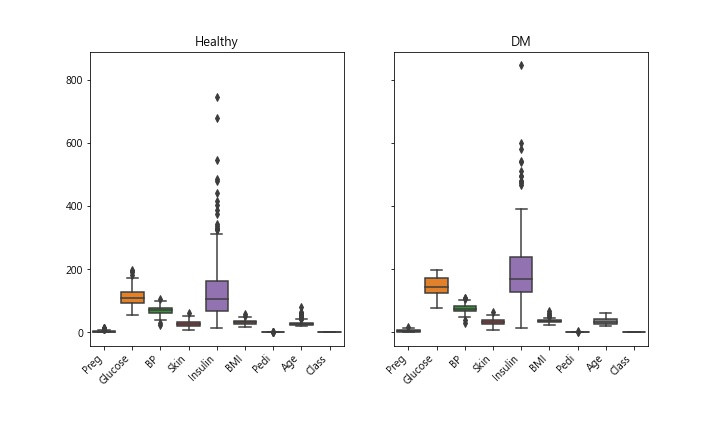
< 檢視資料 > 用EXCEL檢視剩下的資料,蝦米!
全部的案例(有病、無病的)“血糖值都小於200”?
糖尿病的定義不是要血糖值大於200嗎? 我抓錯資料了嗎?
再進去Kaggle看看原始資料集。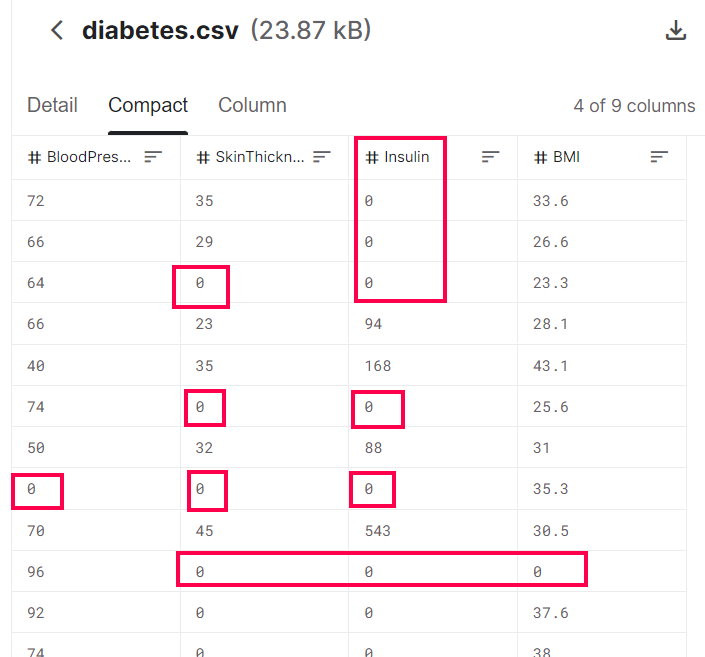
沒錯,Kaggle上的資料集和我的是一樣的,也都是小於200,Why ?
回頭再詳細看一看原創文獻,Case selection第3項:
Only one examination was selected per subject. 每人只選用一次檢驗值
That examination was one that revealed a non-diabetic GTT and met one of the following two criteria: 該次檢驗是在”葡萄糖耐受測試”顯示為”非糖尿病”的那次,同時符合以下兩標準者:
原來如此,所以,資料集裡面的”血糖值”都是正常範圍內的,也就是病人”還沒被診斷出糖尿病之前”的數據。這就很難理解,這些數據並不是直觀的”實驗組”、”對照組”的特徵資料,而是”有病者,發病以前的資料”+”沒病者的資料”。
所以,該文章作者的方法是:使用”未發病前”的資料去預測以後是否會發病。
說實話,這樣的實驗設計有點難理解,而且執行上也不容易。
必須要在同一個社區(族群)內,長期追蹤同一群人5年以上,收案不易、數據測量也不易齊全。
另外,我們再回頭看看上面2014年那篇,好像價值性就沒有那麼高了。因為他們在一群正常數據的人(都是未發病前數據)之中發現血糖與其它項特徵值有正(負)相關,但是卻沒著墨於”預測”。畢竟原創資料集其目的是在於”預測”,而不是看特徵值之”趨勢”、”相關”。
Step 6. Prediction
終於,要來使用資料集了。這個資料集去除了不合理的數值後(應該是當時沒做測量,就給個0),剩下392筆可用,只佔原本768筆的一半。
經過上面冗長的考古之後,我們就選兩種方法來建立模型、預測吧。
LogisticRegression、RandomForest
直接進代碼吧
''' Step 6. 準備資料,設定 X ,y  '''
from sklearn.model_selection import train_test_split
from sklearn.preprocessing import StandardScaler

y = df_Trim['Class']    # y 診斷結果= Class
''' 去除 target欄位,留下特徵欄位-->X '''
X = df_Trim.drop(['Class'], axis = 1)
print(X.shape)
print(X.head(5))   # X is a dataframe
print(y[:5])       # y is a Series

# split dataset
X_train, X_test, y_train, y_test = train_test_split(X, y,
                                                    test_size=0.2,
                                                    stratify=y,
                                                    random_state=0)

#print(len(X_train),len(X_test))

''' Step 7. Build the Model : training'''

# model logistic regression
from sklearn.linear_model import LogisticRegression

logis = LogisticRegression(solver='lbfgs',max_iter = 400)
logis.fit(X_train, y_train)

# model random forest

from sklearn.ensemble import RandomForestClassifier

fores = RandomForestClassifier()
fores.fit(X_train, y_train)

''' Step 8. 評估模型準確度  兩種model的accuracy '''
from sklearn.metrics import accuracy_score

pred_logis = logis.predict(X_test)
pred_fores = fores.predict(X_test)

a1 = accuracy_score(pred_logis, y_test)
a2 = accuracy_score(pred_fores, y_test)
print(f'兩種模型的準確率 accuracy: logis: {a1}  fores: {a2}')

''' Step 9. 儲存模型  '''
import pickle

mdl_DMlr = 'DMlr.model'
pickle.dump(logis, open(mdl_DMlr, 'wb'))
mdl_DMfs = 'DMfs.model'
pickle.dump(fores, open(mdl_DMfs, 'wb'))
print(' 建模完成 models saved ')
寫個py,使用模型預測
""" PimaDM_ModelUse.py 2021-09-14 neoCaffe
    使用建立好的模型,進行診斷預測 diabetes
    從 PimaDM.csv取兩筆,預測是否發病
"""
print(__doc__)

import pandas as pd
import random
import pickle
''' 載入資料集 '''
df = pd.read_csv('pimaDM.csv')
r,c = df.shape
''' 任意取兩筆 '''
n = random.randint(0,r)
test1 = list(df.iloc[n].values)
m = random.randint(0,r)
test2 = list(df.iloc[m].values)
# 真正的診斷
Dx1 = test1[-1]
Dx2 = test2[-1]
# 特徵值
test1 = [test1[:-1]]
test2 = [test2[:-1]]


print('隨機取兩筆資料,當測試')
print(f'特徵:{test1}  診斷: {Dx1}')
print(f'特徵:{test2}  診斷: {Dx2}')


''' 以兩種模型進行預測  '''
print('以兩種模型進行預測''')
mdl_logis = pickle.load(open('DMlr.model', 'rb'))
predict1 = mdl_logis.predict(test1)

mdl_fores = pickle.load(open('DMfs.model', 'rb'))
predict2 = mdl_fores.predict(test2)

print(f'test1 真正診斷是: {Dx1}  以logis模型預測是: {predict1}')
print(f'test2 真正診斷是: {Dx2}  以fores模型預測是: {predict2}')
成果畫面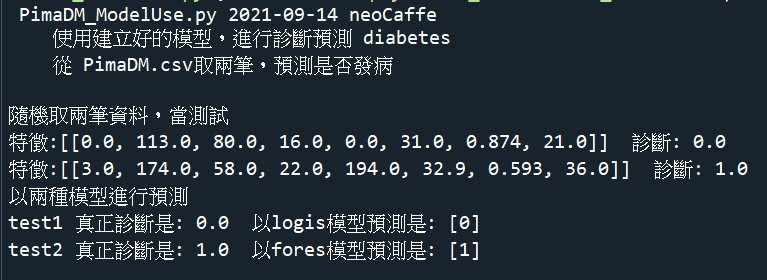
結案收工,以上程式碼在GitHub
< source code+csv download GitHub >
