什麼是互動?簡單說希望能夠讓使用者允許監聽和分派事件,用比較白話的一點方式舉例就是當我們滑鼠按下某個元素的時候,圖表會呈現某些樣貌,監聽就是滑鼠按下的意思,委派就是讓圖表呈現某些樣貌,
對應到的原生Js說明可以參考
Event reference-MDN
其他更多說明也可以參考d3JSAPI文件
官方API事件處理
首先我們要有一個所選取的元素,在後面透過方法鏈的方式添加要執行的函式,這邊可以直接就範例學習即可,例如我們預做出一個當按鈕按下去就會產生隨機的長條圖,我們可以先把按鈕和長條圖準備好
創建好的範例如下
<style>
.btn {
      padding: 8px;
      background-color: orange;
      border: none;
      border-radius: 4px;
    }
.btn:hover {
  background-color: rgba(255, 166, 0, 0.664);
  cursor: pointer;
}
</style>
<body>
  <script>
    const btn = d3.select("body")
                .append("button")
                .text("按鈕")
                .style("display", "block")
                .classed("btn", true);
    let randomIntFun = d3.randomInt(50, 400);
    let randomArr = [];

    for (let index = 0; index < 20; index++) {
      randomArr.push(randomIntFun());
    }
    let padding = 40;
    const svg = d3
      .select("body")
      .append("svg")
      .attr("width", 800)
      .attr("height", 450);
    svg.selectAll("rect")
      .data(randomArr)
      .join("rect")
      .attr("x", (d, i) => {
        return padding + i * 30;
      })
      .attr("y", () => 400 + padding)
      .attr("width", 20)
      .attr("height", 0)
      .attr("fill", "green")
      .transition()
      .duration("1000")
      .attr("y", (d) => {
        return 400 - d + padding;
      })
      .attr("height", (d) => {
        return d;
      });

    let scaleY = d3.scaleLinear().domain([0, 400]).range([400, 0]);
    let axisY = d3.axisRight(scaleY);

    const g = svg.append("g");
    axisY(g);
    g.attr("transform", `translate(0,40)`);
  </script>
</body>
此時畫面還不會動,之後將會加入監聽事件
這裡用到了
randomInt()的方法,簡單說是創建一個函式,這個函式執行後會回傳隨機的整數,randomInt()裡面填的數值是最小值和最大值,根據範例就可以產生出最小值50,最大值400的隨機亂數,然後使用for迴圈將產生的數值使用array push到陣列當中,總共執行二十次。
d3官方文件randomInt
補充二第58行的地方
g.attr("transform", "translate(0,40)")的地方使用了transform,有時候我們渲染出來的座標與圖表位置沒有對應到的時候可以使用這個屬性來調整它,可以參考MDN-SVG-transform
接下來我們預計使用滑鼠點擊的事件因此在 on()內第一個參數填入click,第二個參數則是填入要執行的function,我們預計每次按下按鈕的時候畫出一個長條圖,因此先取名叫做render函式
     const btn = d3.select("body")
        .append("button")
        .text("按鈕")
        .style("display", "block")
        .classed("btn", true)
        .on("click", render);
這時候我們將剛剛所建立的長條圖和隨機產生數字的程式碼用function render()包住此時大概會長這樣
    function render() {
        let randomIntFun = d3.randomInt(50, 400);
        let randomArr = [];

        //中間如上面的程式碼故省略......
        //中間如上面的程式碼故省略......
        //中間如上面的程式碼故省略......

        let scaleY = d3.scaleLinear().domain([0, 400]).range([400, 0]);
        let axisY = d3.axisRight(scaleY);

        const g = svg.append("g");
        axisY(g);
        g.attr("transform", `translate(0,40)`);
    }
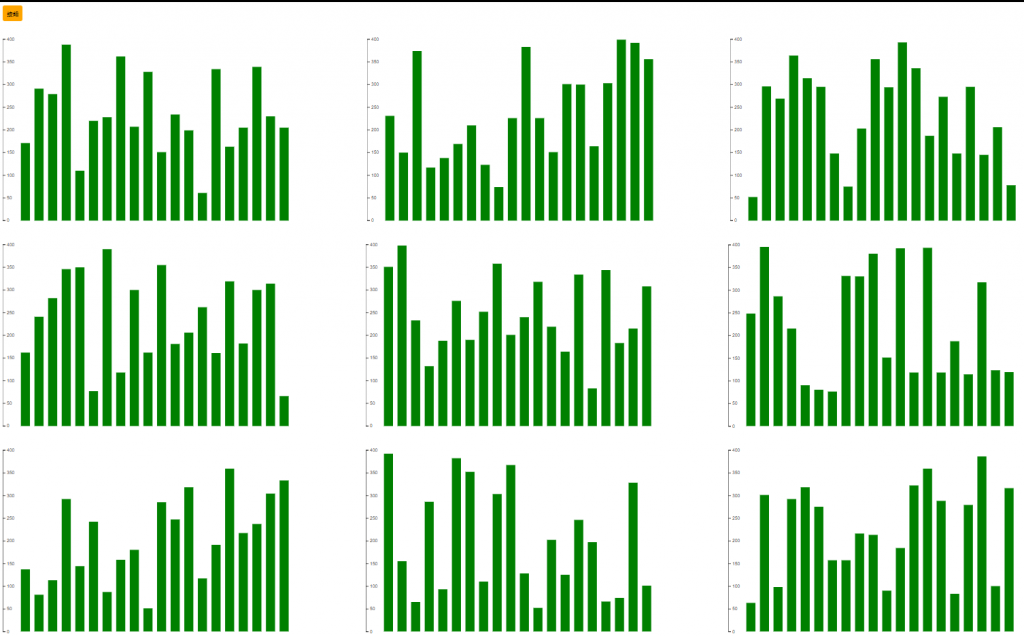
這時候按下按鈕會發現它將會再次新增一筆,所以我們一直按的話會看到下圖
因此我們在執行render function的時候要先把先前的svg給移除掉如下程式碼 d3.select("body").select("svg").remove();這一行,另外希望畫面第一次載入的時候有一個長條圖,因此可以先執行一次render()
    function render() {
       d3.select("body").select("svg").remove();
        let randomIntFun = d3.randomInt(50, 400);
        let randomArr = [];

        //中間如上面的程式碼故省略......
        //中間如上面的程式碼故省略......
        //中間如上面的程式碼故省略......

        let scaleY = d3.scaleLinear().domain([0, 400]).range([400, 0]);
        let axisY = d3.axisRight(scaleY);

        let g = svg.append("g");
        axisY(g);
        g.attr("transform", `translate(0,40)`);
    }
    render();
完整程式碼參考如下的codepen
實際樣貌如下圖
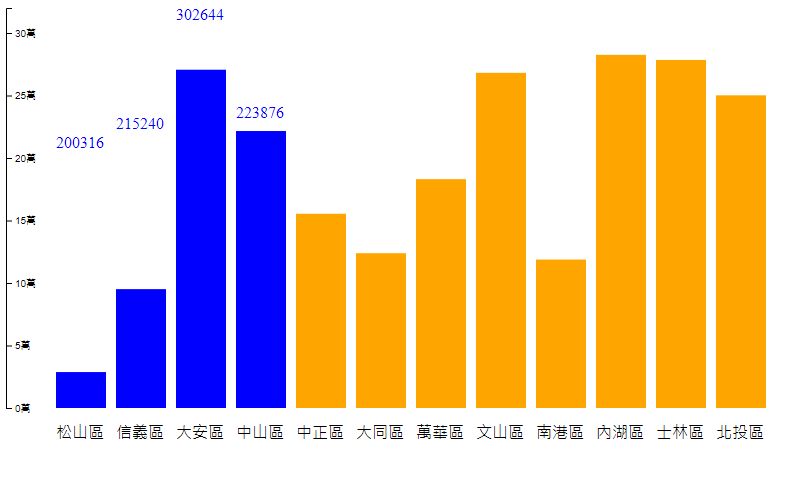
延續前幾天的程式碼我們希望可以再滑鼠滑入到某個 <rect>的時候列出對應到的人口實際數字,另外添加過渡動畫改變長條圖的顏色,當滑鼠移出該rect的時候變回來。
因此我們再前幾天的程式碼後面添加以下片段
svg.selectAll("rect")
  .on("mouseenter", function () {
    const thisRectX = d3.select(this).attr("x"); //存取該 rect的 x屬性位置
    const thisRectY = d3.select(this).attr("y"); //存取該 rect的 y屬性位置
    let text = d3.select(this).data()[0].people_total;
    d3.select(this).transition().duration(800).attr("fill","blue");
    svg.append("text")   //添加文字和id以及thisRectX和
    .attr("id","people-total")
    .attr("x",thisRectX)
    .attr("y", ()=>(scaleY(text)-10))
    .style("fill","blue")
    .text(text);
  })
上述程式碼主要是在滑鼠移入到對應的 rect長條時先存取該rect的x屬性位置和y屬性的位置如第3、4行,這邊的this指向的是你所觸發滑鼠移入事件的元素,另外也宣告text變數來儲存你所指的元素的資料,第7~12行就是在svg底下添加text元素,然後各個屬性的值來自於剛剛第3、4、5行所取的值,另外為了之後方便移除,所以在text元素添加了一個id屬性,到目前為止只有由於執行mouseenter Event也就是滑鼠移入事件,目前當我們滑鼠離開 rect元素的時候,顏色沒有變回來,上方的數值也沒有消失
如下圖
所以我們得在添加關於離開元素的時候的程式碼,程式碼如下
svg.selectAll("rect")
  .on("mouseenter", function () {
    const thisRectX = d3.select(this).attr("x");
    const thisRectY = d3.select(this).attr("y");
    let text = d3.select(this).data()[0].people_total;
    d3.select(this).transition().duration(800).attr("fill","blue");
    svg.append("text")
    .attr("id","people-total")
    .attr("x",thisRectX)
    .attr("y", ()=>(scaleY(text)-10))
    .style("fill","blue")
    .text(text);
}).on("mouseleave",function () {
  d3.select(this)
  .transition()
  .duration(800)
  .attr("fill","orange");
    svg.select("#people-total").remove(this);
})
這邊的this來自於事件的觸發也就是你當滑入進去的元素,方法鏈後面繼續接續一個事件表示滑鼠離開該元素時所要執行的事情,這邊執行的事情直接把剛剛添加的text用id選取起來並移除它,另外也將顏色改變回來。
另外值得注意的是先前程式碼,如果原先的長條圖載入的Bar慢慢變高的動畫三秒鐘期間還沒被執行完的時候,滑鼠移入會導致on事件觸發讓該Bar變成藍色,其中bar的高度就再不會再變化,因此可以包裝一個function 使用setTimeout來延遲執行
完整程式碼如下
const newTaipei = taipei.map((el) => {
      el.people_total = Number(el.people_total);
      el.area = Number(el.area);
      el.population_density = Number(el.population_density);
      el.site_id = el.site_id.substr(3);
      return el;
    });

let padding = 50;
const svg = d3
  .select("body")
  .append("svg")
  .attr("width", 800)
  .attr("height", 450);
let min = d3.min(newTaipei, (d) => d.people_total);
let max = d3.max(newTaipei, (d) => d.people_total);
console.log(newTaipei);
const scaleY = d3.scaleLinear().domain([0, 320000]).range([400, 0]);


svg.selectAll("rect")
.data(newTaipei)
.join("rect")
.attr("x", (d, i) => {
  return padding + i * 60;
})
.attr("y", 400)
.attr("height", 0)
.attr("width", 50)
.attr("fill", "orange")
.transition()
.duration(3000) //由於這裡會載入時間三秒之後的on事件需要等待三秒再執行避免被觸發
.attr("y", (d) => {
  return scaleY(d.people_total);
})
.attr("height", (d) => {
  return 400 - scaleY(d.people_total);
})
;
svg.selectAll("text")
  .data(newTaipei)
  .join("text")
  .text((d) => {
    return d.site_id;
  })
  .attr("x", (d, i) => {
    return padding + i * 60;
  })
  .attr("y", (y) => {
    return 450 - 20;
  });

const axisY = d3.axisRight(scaleY)
              .ticks(5)
              .tickFormat(function (d) {
              return d / 10000 + "萬";
              });
const g = svg.append("g");
axisY(g);
setTimeout(() =>{addBlueEffect()},3000); //避免Bar的高度還沒生長完就觸發變色效果
function addBlueEffect() {
  svg.selectAll("rect")
  .on("mouseenter", function () {
  const thisRectX = d3.select(this).attr("x");
  const thisRectY = d3.select(this).attr("y");
  const text = d3.select(this).data()[0].people_total;
  d3.select(this)
  .transition().duration(800).attr("fill","blue")
  ;
  svg.append("text")
  .attr("id","people-total")
  .attr("x",thisRectX)
  .attr("y", ()=>(scaleY(text)-10))
  .style("fill","blue")
  .text(text);

  }).on("mouseleave",function () {
  d3.select(this)
  .transition()
  .duration(800)
  .attr("fill","orange");
    svg.select("#people-total").remove(this);
  })
}
呈現效果如下圖
githubPage如下