以下節錄自維基百科樹狀結構
樹狀結構(英語:Tree structure),又譯樹形結構,或稱樹狀圖(tree diagram)是一種將階層式的構造性質,以圖象方式表現出來的方法。它的名稱來自於以樹的象徵來表現出構造之間的關係,雖然在圖象的呈現上,它是一個上下顛倒的樹,其根部在上方,是資料的開頭,而下方的資料稱為葉子。
樹形結構是一層次的巢狀結構。 一個樹形結構的外層和內層有相似的結構, 所以,這種結構多可以遞迴的表示。樹狀結構只是一個概念,可以用許多種不同形式來展現。在數學的圖論與集合論中,對於樹狀結構的性質探討是一個重要課題。在計算機科學中,則以樹狀資料結構作為討論主題。
簡單說,樹狀結構可以了解整個具有父子關係的結構,另外這邊d3的tree和計算機科學當中的tree資料結構有點不一樣,這邊僅代表d3JS繪製出tree的方法前所需要的資料樣貌
在做樹狀圖之前首先要先了解一下d3-hierarchy
表示巢狀資料結構呈現像樹一樣,除了根節點之外,每一個節點都有一個父節點,同樣的除了葉子以外每一個都有一個或多個子節點。
這邊舉例JSON檔案如下
const treeData =
{
  "name": "Eve",
  "children": [
    {
      "name": "Cain"
    },
    {
      "name": "Seth",
      "children": [
        {
          "name": "Enos"
        },
        {
          "name": "Noam"
        }
      ]
    },
    {
      "name": "Abel"
    },
    {
      "name": "Awan",
      "children": [
        {
          "name": "Enoch"
        }
      ]
    },
    {
      "name": "Azura"
    }
  ]
};
資料來自官網
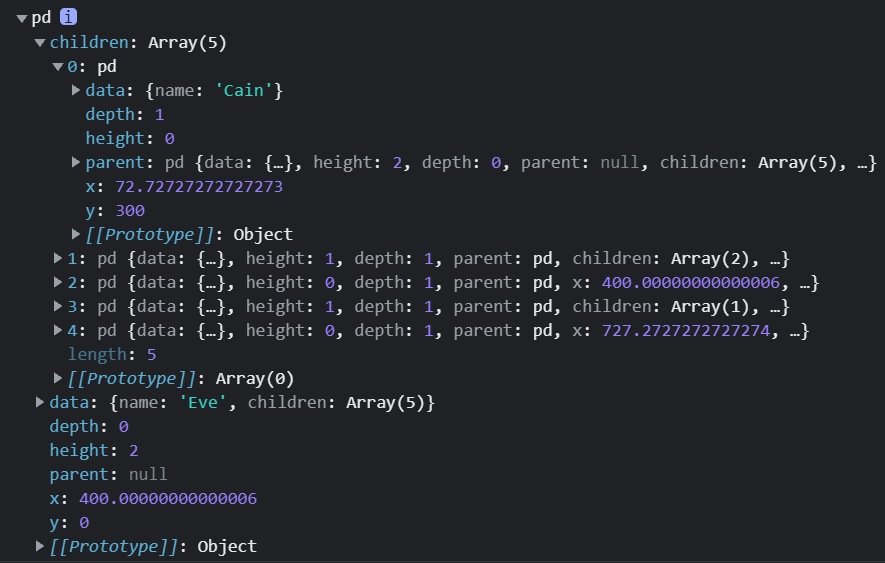
這時候我們可以將treeData做階層化並且觀看其console.log()會出現什麼東西程式碼如下
const hierarchyData = d3.hierarchy(treeData, function(d){
    return d.children;
})
console.log(hierarchyData);
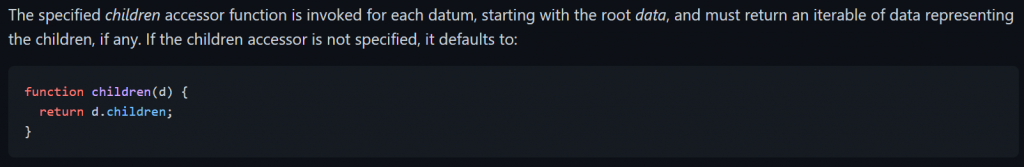
這邊值得一提的是官網說可以指定要訪問哪一個欄位當作children來走訪生成,如果沒有指定的話就會預設值是訪問d.children的欄位,由於我們原始資料treeData就有children這個key,因此就算沒有在hierarchy函數內設定function的話也會預設訪問children這個key。
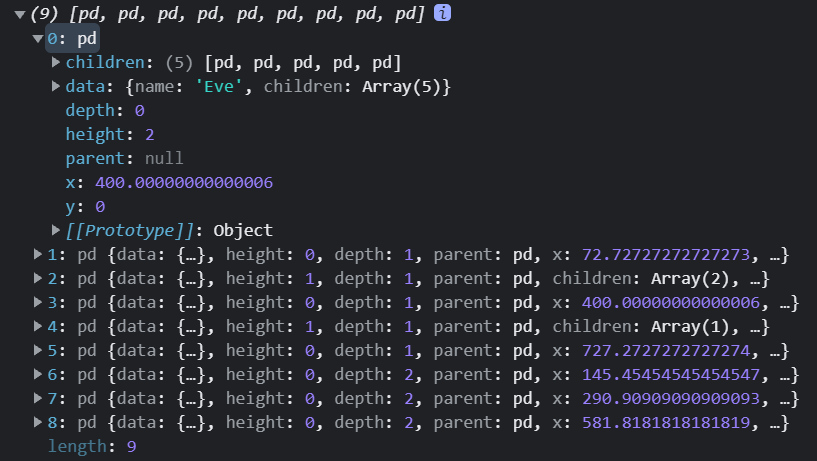
接下來觀看console.log後可以發現hierarchy()將會把整個原先的物件轉換後增加一些key來說明階層關係,物件最外層的就是對應到剛剛原始資料的最外層,展開裡面可以發現紀錄了depth和height和x與y
接下來我們要設置樹的大小,這邊設定size的寬是800和高600
const tree = d3.tree().size([800,600]);
使用tree的佈局產生樹枝的頭(source)和尾(target)
官網API說明如下
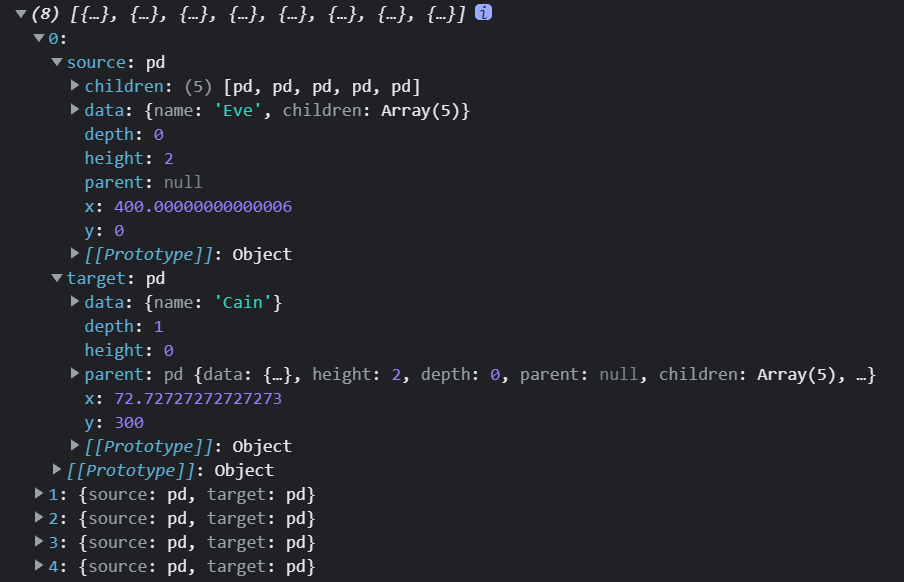
將轉換後的階層化數據帶入成tree布局後使用links(),這邊可以使用console.log來觀看其經過轉換函式的樣貌
console.log(tree(hierarchyData).links());
觀看開發者人員工具將會生成一個陣列儲存每個節的source和target
如下圖
有了經過link()轉換後的資料,接下來就可以開始畫圖了
我們將剛剛生成的數據使用svg的line繪製進行data綁定之後,svg的x1和y1的屬性值設定為剛剛的source,svg的x2和y2屬性設定為target,程式碼如下
let padding = 20;
let width =800-padding-padding;
let height = 600-padding-padding;
const svg = d3.select(".container")
            .append("svg")
            .attr("width", width+padding+padding)
            .attr("height", height+padding+padding)
            .append('g')
            .attr('transform', `translate(${padding},${padding})`)

const tree = d3.tree().size([800,600]);
let hierarchyData = d3.hierarchy(treeData, function(d){
    return d.children;
})
const g = svg.append("g")
g.selectAll("line").data(tree(hierarchyData).links())
.join("line")
.attr("x1",(d)=>(d.source.x))
.attr("y1",d=>( d.source.y))
.attr("x2",d=>( d.target.x))
.attr("y2",d=>( d.target.y))
.style('stroke', "black")
.style('stroke-width', "2px");
如下圖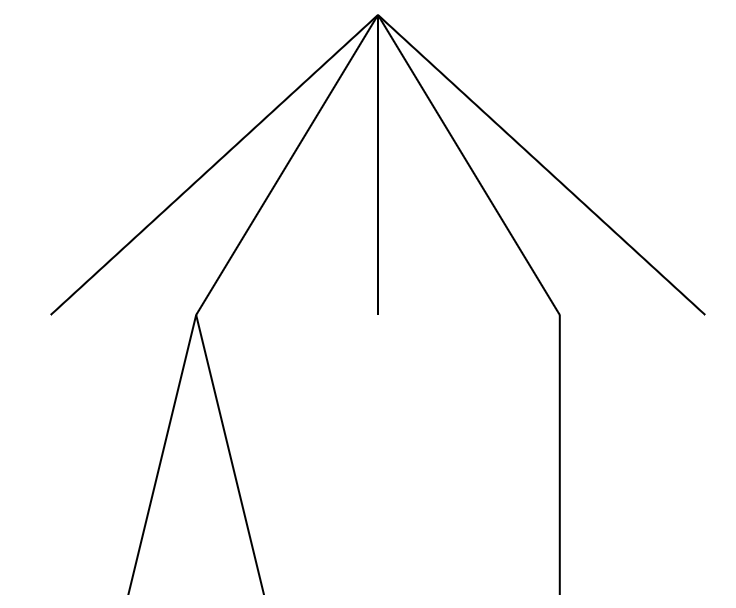
接下來使用node.descendants()來製作節點
官方API指出會產生所有後代節點的陣列,換句話說就是將剛剛的hierarchyData做扁平化處理

可以撰寫程式碼觀看內容
console.log(tree(hierarchyData).descendants());
如下圖可以發現它將所有子節點給取出做成一個陣列了
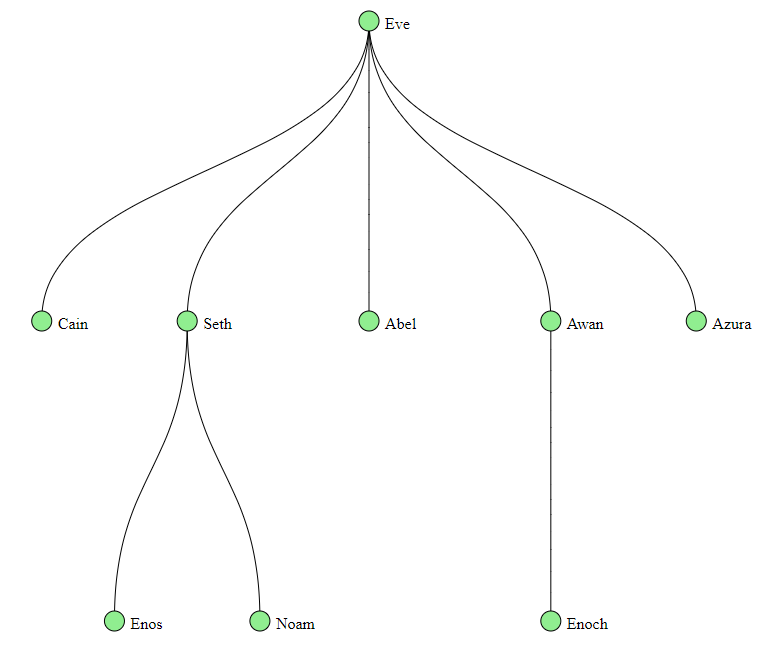
接下來我們在svg插入一個g元素裡面預計使用join生成許多g後把資料綁定在上面以便裡面放入circle和text顯示節點樣貌和內容。
在剛剛創建class名為g-node的元素選取起來後插入circle和text記得微調一下text的位置讓它不要和circle重疊即可
具體程式碼如下
 let gNode = svg.append("g")
  .selectAll("g")
  .data(tree(hierarchyData).descendants())
  .join("g")
  .classed("g-node",true);

  d3.selectAll(".g-node")
  .append("circle")
  .attr('cx', function(d) {return d.x;})
  .attr('cy', function(d) {return d.y;})
  .attr('r', 10)
  .attr("fill", "lightgreen")
  .attr('stroke', "black")
  .attr('stroke-width', 1);


  d3.selectAll(".g-node")
  .append("text")
  .attr('x', function(d) {return d.x;})
  .attr('y', function(d) {return d.y;})
  .attr("dy", ".5em")
  .attr("dx", "1em")
  .style("text-anchor", "start")
  .text(function(d) {return d.data.name})
最後你應該會看到如下圖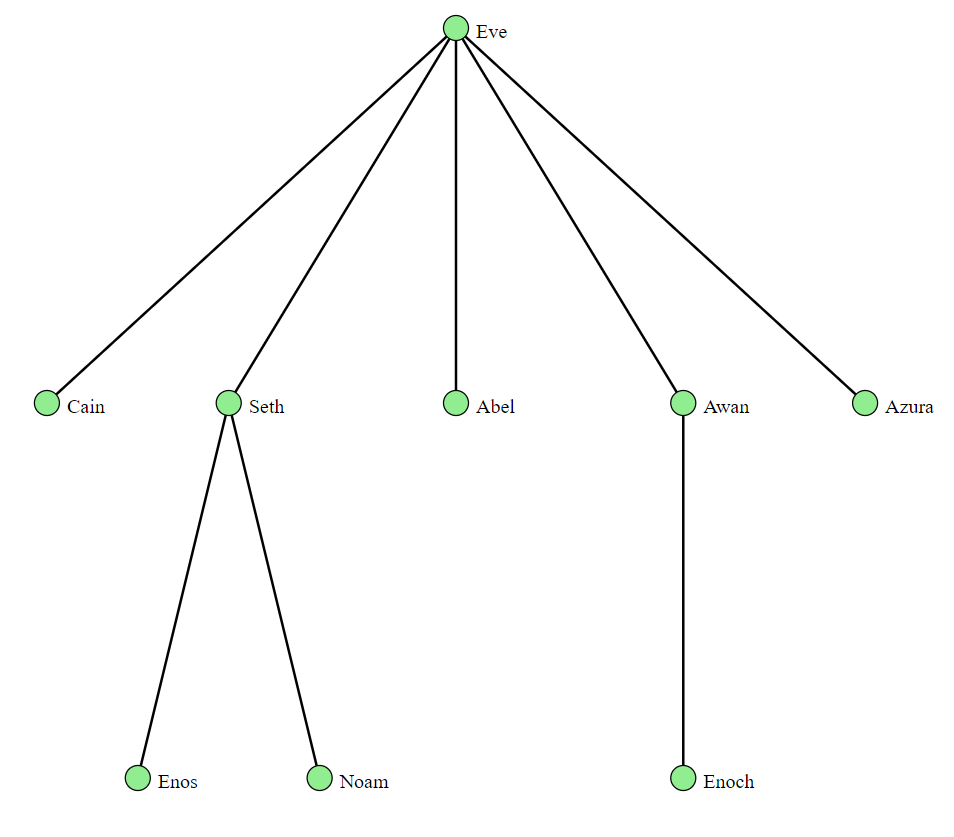
這邊的樹枝由於使用的是svg的line元素,因此整個線段會是筆直的線段,如果要有點曲線的樣貌,必須改用path元素,這裡有兩種方法一種是手寫M和C的設定,另一種是使用d3的link產生器,
這邊簡單帶一下手寫的方法
g.selectAll("path")
  .data(tree(hierarchyData).descendants().slice(1))
  .join("path")
  .attr("d", function(d) {
       return "M" + d.x + "," + d.y
         + "C" + d.x + "," + (d.y + d.parent.y) / 2
         + " " + d.parent.x + "," +  (d.y + d.parent.y) / 2
         + " " + d.parent.x + "," + d.parent.y;
       })
  .attr("stroke","black").attr("fill","none");
將原本join是line元素改成path,另外注意要帶入的資料如這行所示tree(hierarchyData).descendants().slice(1),使用.descendants()的轉換後並且要使用slice刪除第一筆,不然會報錯,因為該筆的y是null。
接下來應該會看到如下圖
這邊主要介紹第二種方法使用linkVertical
官方API說明它將會回傳Link產生器,用來呈現樹狀圖的顯示
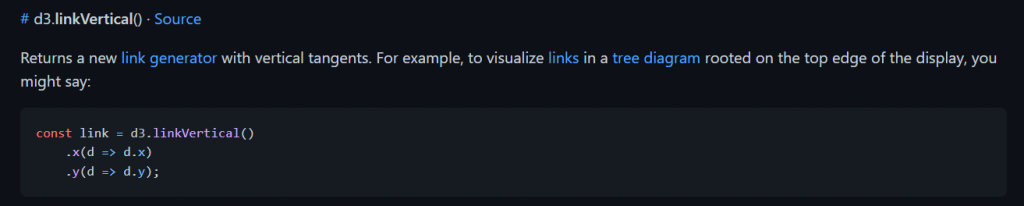
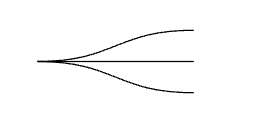
可以先撰寫以下程式碼觀看呈現樣貌會比較好理解
<svg width="800" height="600" id="multiLink"></svg>
<script>
    let linkGen = d3.linkHorizontal();

    let multiLinkData = [
    {source: [50,50], target: [175,25]},
    {source: [50,50], target: [175,50]},
    {source: [50,50], target: [175,75]},
    ];

    d3.select("#multiLink")
    .selectAll("path")
    .data(multiLinkData)
    .join("path")
    .attr("d", linkGen)
    .attr("fill", "none")
    .attr("stroke", "black");
</script>
之後你應當會看到如下圖
因此我們要繪製這種圖形的時候先備資料含有source和target的物件來作為線段的起始點和終點,還記得剛剛我們使用tree(hierarchyData).links()所轉換的資料嗎?其中的key就含有source和target
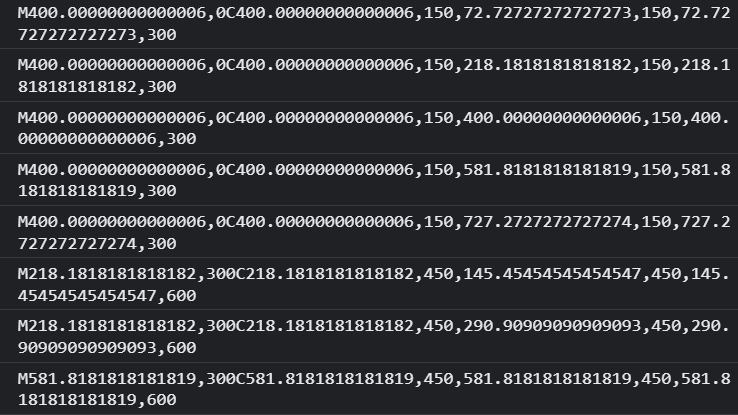
我們撰寫程式碼如下,最後呈現的圖將會與剛剛手動的效果一樣,另外我們也可以console.log()觀看在轉換過程當中所呈現的內容是什麼
const linkMkr = d3.linkVertical().x(d=>d.x).y(d=>d.y); //使用link產生器指定成垂直的樣貌
g.selectAll("path").data(tree(hierarchyData)
  .links())
  .join("path")
  .attr("d",d=>{
    console.log(linkMkr(d));
    return linkMkr(d)}
    )
  .attr("stroke","black").attr("fill","none");
其實就是將原本的資料轉換成path的M、C的相關數值而已如下圖
最後呈現應該會和剛剛手寫的圖一樣
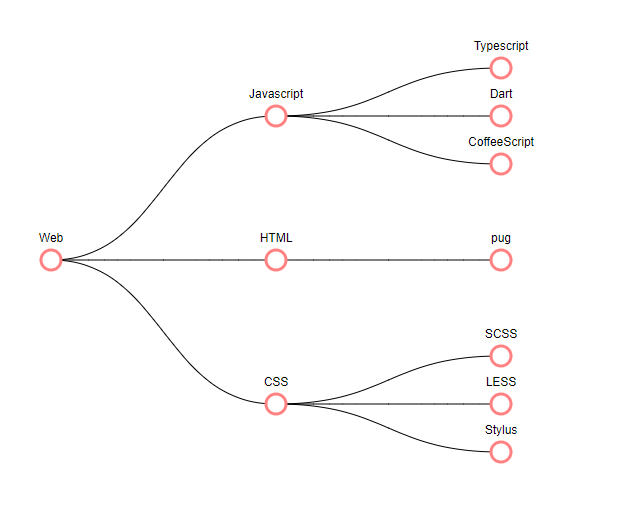
除了垂直的樹狀圖以外也可以使用linkHorizontal()產生水平的樹狀圖,這裡使用樹狀圖來呈現web的子集技術如下圖
程式碼如下
<style>
  .node circle {
    fill: rgb(255, 255, 255);
    stroke: rgb(255, 130, 130);
    stroke-width: 3px;
  }
  .node text {
    font: 12px sans-serif;
  }
  .link {
    fill: none;
    stroke: #ccc;
    stroke-width: 2px;
  }
</style>
<body>
  <script>
    let treeData = {
      name: "Web",
      children: [
        {
          name: "Javascript",
          children: [
            { name: "Typescript" },
            { name: "Dart" },
            { name: "CoffeeScript" },
          ],
        },
        {
          name: "HTML",
          children: [{ name: "pug" }],
        },
        {
          name: "CSS",
          children: [{ name: "SCSS" }, { name: "LESS" }, { name: "Stylus" }],
        },
      ],
    };
    //設定邊界
    let margin = { top: 20, right: 90, bottom: 30, left: 90 },
      width = 660 - margin.left - margin.right,
      height = 500 - margin.top - margin.bottom;

      //設定樹寬高

    let tree = d3.tree().size([width, height]);

    //將數據階層化
    let hierarchyData = d3.hierarchy(treeData, function (d) {
      return d.children;
    });

    // 將階層化的數據帶入tree layout
    hierarchyData = tree(hierarchyData);

    let svg = d3
      .select("body")
      .append("svg")
      .attr("width", width + margin.left + margin.right)
      .attr("height", height + margin.top + margin.bottom),
      g = svg
        .append("g")
        .attr("transform", "translate(" + margin.left + "," + margin.top + ")");
    //創建一個水平link產生器
    let linkMkr = d3
      .linkHorizontal()
      .x((d) => d.y)
      .y((d) => d.x);
    //繪製出樹枝
    g.selectAll("path").data(hierarchyData.links())
    .join("path")
    .attr("d",d=>{
      return linkMkr(d);
    })
    .attr("stroke","black").attr("fill","none");


    let node = g
      .selectAll(".node")
      .data(hierarchyData.descendants())
      .join("g")
      .attr("class", "node")
      .attr("transform", function (d) {
        return "translate(" + d.y + "," + d.x + ")";
      });

    node.append("circle").attr("r", 10);

    node
      .append("text")
      .attr("dy", "-1.5em")
      .style("text-anchor", function (d) {
        return "middle";
      })
      .text(function (d) {
        return d.data.name;
      });
  </script>
</body>
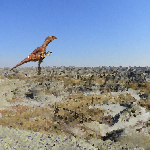
另外svg裡面也可以帶入image,使用<image>標籤,資料物件裡面涵蓋image的URL就可以呈現,如下圖使用樹狀圖來表示蕨類植物的父子關係,線的style改變顏色,可能代表蕨類有是長子或是不孕等等情況
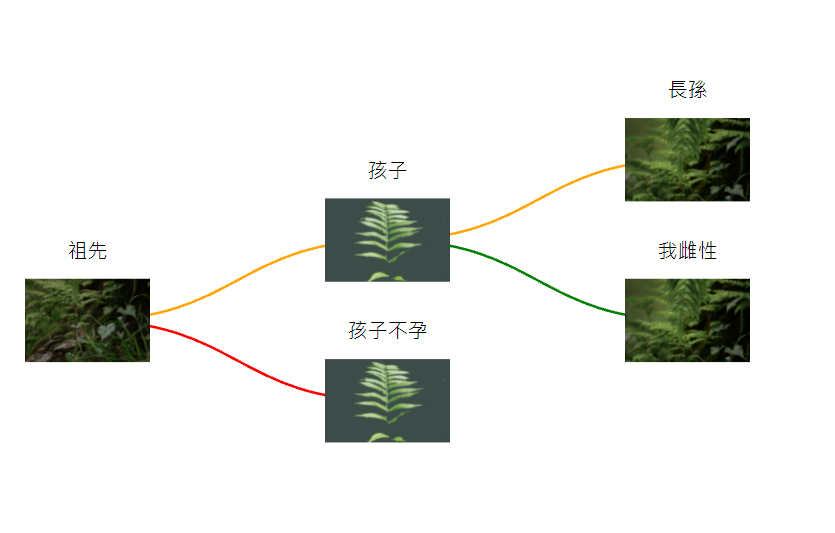
圖片來源:Unsplash
程式碼如下
<style>
  .node text {
    font: 12px;
  }
  .link {
    fill: none;
    stroke-width: 2px;
  }
</style>
<body>
  <script>
    let treeData = {
      name: "祖先",
      level: "red",
      icon: "https://images.unsplash.com/photo-1616504152265-535fb626017d?ixid=MnwxMjA3fDB8MHxwaG90by1wYWdlfHx8fGVufDB8fHx8&ixlib=rb-1.2.1&auto=format&fit=crop&w=2070&q=80",
      children: [
        {
          name: "孩子",
          level: "orange",
          icon: "https://images.unsplash.com/photo-1483718983629-1100e0808b32?ixid=MnwxMjA3fDB8MHxwaG90by1wYWdlfHx8fGVufDB8fHx8&ixlib=rb-1.2.1&auto=format&fit=crop&w=1170&q=",
          children: [
            {
              name: "長孫",
              icon: "https://images.unsplash.com/photo-1616504152528-c46d3292a6ff?ixid=MnwxMjA3fDB8MHxwaG90by1wYWdlfHx8fGVufDB8fHx8&ixlib=rb-1.2.1&auto=format&fit=crop&w=1170&q=80",
              level: "orange",
            },
            {
              name: "我雌性",
              icon: "https://images.unsplash.com/photo-1616504152528-c46d3292a6ff?ixid=MnwxMjA3fDB8MHxwaG90by1wYWdlfHx8fGVufDB8fHx8&ixlib=rb-1.2.1&auto=format&fit=crop&w=1170&q=80",
              level: "green",
            },
          ],
        },
        {
          name: "孩子不孕",
          icon: "https://images.unsplash.com/photo-1483718983629-1100e0808b32?ixid=MnwxMjA3fDB8MHxwaG90by1wYWdlfHx8fGVufDB8fHx8&ixlib=rb-1.2.1&auto=format&fit=crop&w=1170&q=",
          level: "red",
        },
      ],
    };

    let margin = { top: 20, right: 90, bottom: 30, left: 90 },
      width = 660 - margin.left - margin.right,
      height = 500 - margin.top - margin.bottom;

    let tree = d3.tree().size([height, width]);

    let nodes = d3.hierarchy(treeData, function (d) {
      return d.children;
    });

    nodes = tree(nodes);

    let svg = d3
        .select("body")
        .append("svg")
        .attr("width", width + margin.left + margin.right)
        .attr("height", height + margin.top + margin.bottom),
      g = svg
        .append("g")
        .attr("transform", "translate(" + margin.left + "," + margin.top + ")");

    let linkMkr = d3
      .linkHorizontal()
      .x((d) => d.y)
      .y((d) => d.x);
    let link = g
      .selectAll("path")
      .data(nodes.links())
      .join("path")
      .attr("class", "link")
      .style("stroke", function (d) {
        return d.target.data.level;
      })
      .attr("d", function (d) {
        return linkMkr(d);
      })
      .attr("stroke", "black")
      .attr("fill", "none");
    let node = g
      .selectAll(".node")
      .data(nodes.descendants())
      .enter()
      .append("g")
      .attr("transform", function (d) {
        return "translate(" + d.y + "," + d.x + ")";
      });

    node
      .append("image")
      .attr("xlink:href", function (d) {
        return d.data.icon;
      })
      .attr("x", "-50px")
      .attr("y", "-50px")
      .attr("width", "100px")
      .attr("height", "100px");

    node
      .append("text")
      .attr("x", "0")
      .attr("y", "-50")
      .style("text-anchor", "middle")
      .text(function (d) {
        return d.data.name;
      });
  </script>
</body>
最後本日附上githubPage的頁面
原始範例樹狀圖範例
Image樹狀圖範例
水平web技術子集樹狀圖
link產生器範例


 iThome鐵人賽