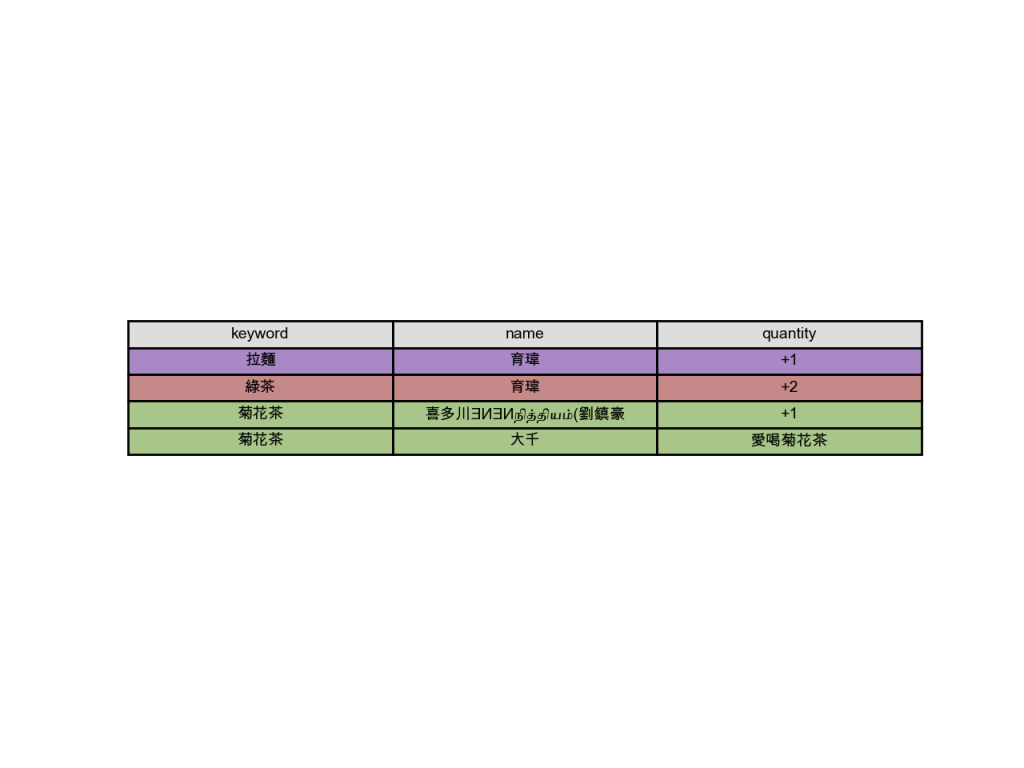
為了方便檢視這邊我挑了6種顏色幫表格上色
cursor = conn.cursor()
cursor.execute(f"SELECT keyword,name,quantity FROM group_buying_user NATURAL JOIN group_buying_message order by keyword;")
users = cursor.fetchall()
cursor.close()
plt.rcParams['font.sans-serif'] = ['Arial Unicode MS']
fig, ax =plt.subplots(1,1)
data=[]
color=[]
#這裡我挑了6種顏色做循環
color_list = ["#89C6C6","#A889C6","#C68989","#A8C689","#C07BC0","#C6C689"]
category=''
i=0
column_labels=['keyword','name','quantity']
for user in users:
    if not category==user[0]:
        if i==len(color_list)-1:
            i=0
        else:
            i=i+1
    color.append([color_list[i],color_list[i],color_list[i]])
    category=user[0]
    data.append([user[0],user[1],user[2]])
ax.axis('tight')
ax.axis('off')
ax.table(cellText=data,colColours=["#DDDDDD"]*3,cellColours=color,colLabels=column_labels,cellLoc='center',loc="center")
plt.savefig('img/table.png',dpi=200)

