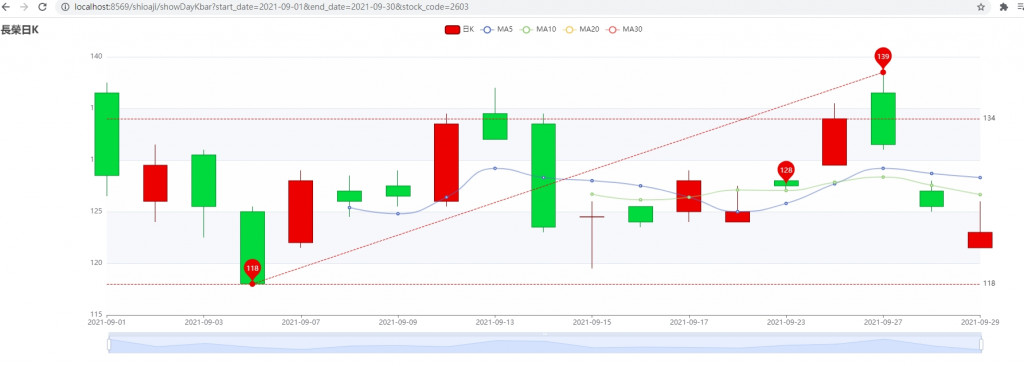
先上最後的成果圖~
今天我們的範例換一個套件,
這次我們使用的是echarts,
跟之前一樣,取出kbar_data資料,
const kbar_data = $("#kbar_data").val();
const myArr = JSON.parse(kbar_data);
將他放入套件的範例中就會出現上面的成果,
const data0 = splitData(myArr);
但這個土法煉鋼的方法有個大問題(昨天controller的部分),
就是他的呼叫時間非常久,
60天就要呼叫60次,
而且使用到雙層迴圈在程式中是不太ok的,
所以我自己認為比較好的方法是"一次呼叫需要的時間區間"並存到資料表中,
存到資料表後用sql會比較好處理、過濾,
不管你是用nosql還是關聯式資料庫,
這樣也只會呼叫到一次api,
呼叫花費的時間可以縮短非常多。
完整html、js如下:
<!DOCTYPE html>
<html xmlns:th="http://www.thymeleaf.org">
<head>
	<script type="text/javascript" th:src="@{/js/jquery-3.3.1.min.js}" ></script>
</head>
<body  >

<input type="hidden" id="kbar_data" th:value="${kbar_data}"/>
 <div id="container" style="height: 600px"></div>

        <script type="text/javascript" src="https://cdn.jsdelivr.net/npm/echarts@5.2.1/dist/echarts.min.js"></script>

<script type="text/javascript">
const kbar_data = $("#kbar_data").val();
const myArr = JSON.parse(kbar_data);

var dom = document.getElementById("container");
var myChart = echarts.init(dom);
var app = {};
var option;

const upColor = '#ec0000';
const upBorderColor = '#8A0000';
const downColor = '#00da3c';
const downBorderColor = '#008F28';
// Each item: open,close,lowest,highest
const data0 = splitData(myArr);
function splitData(rawData) {
  const categoryData = [];
  const values = [];
  for (var i = 0; i < rawData.length; i++) {
    categoryData.push(rawData[i].splice(0, 1)[0]);
    values.push(rawData[i]);
  }
  return {
    categoryData: categoryData,
    values: values
  };
}
function calculateMA(dayCount) {
  var result = [];
  for (var i = 0, len = data0.values.length; i < len; i++) {
    if (i < dayCount) {
      result.push('-');
      continue;
    }
    var sum = 0;
    for (var j = 0; j < dayCount; j++) {
      sum += +data0.values[i - j][1];
    }
    result.push(sum / dayCount);
  }
  return result;
}
option = {
  title: {
    text: '長榮日K',
    left: 0
  },
  tooltip: {
    trigger: 'axis',
    axisPointer: {
      type: 'cross'
    }
  },
  legend: {
    data: ['日K', 'MA5', 'MA10', 'MA20', 'MA30']
  },
  grid: {
    left: '10%',
    right: '10%',
    bottom: '15%'
  },
  xAxis: {
    type: 'category',
    data: data0.categoryData,
    scale: true,
    boundaryGap: false,
    axisLine: { onZero: false },
    splitLine: { show: false },
    min: 'dataMin',
    max: 'dataMax'
  },
  yAxis: {
    scale: true,
    splitArea: {
      show: true
    }
  },
  dataZoom: [
    {
      type: 'inside',
      start: 50,
      end: 100
    },
    {
      show: true,
      type: 'slider',
      top: '90%',
      start: 50,
      end: 100
    }
  ],
  series: [
    {
      name: '日K',
      type: 'candlestick',
      data: data0.values,
      itemStyle: {
        color: upColor,
        color0: downColor,
        borderColor: upBorderColor,
        borderColor0: downBorderColor
      },
      markPoint: {
        label: {
          formatter: function (param) {
            return param != null ? Math.round(param.value) + '' : '';
          }
        },
        data: [
          {
            name: 'Mark',
            coord: ['2021/9/1', 2603],
            value: 2603,
            itemStyle: {
              color: 'rgb(41,60,85)'
            }
          },
          {
            name: 'highest value',
            type: 'max',
            valueDim: 'highest'
          },
          {
            name: 'lowest value',
            type: 'min',
            valueDim: 'lowest'
          },
          {
            name: 'average value on close',
            type: 'average',
            valueDim: 'close'
          }
        ],
        tooltip: {
          formatter: function (param) {
            return param.name + '<br>' + (param.data.coord || '');
          }
        }
      },
      markLine: {
        symbol: ['none', 'none'],
        data: [
          [
            {
              name: 'from lowest to highest',
              type: 'min',
              valueDim: 'lowest',
              symbol: 'circle',
              symbolSize: 10,
              label: {
                show: false
              },
              emphasis: {
                label: {
                  show: false
                }
              }
            },
            {
              type: 'max',
              valueDim: 'highest',
              symbol: 'circle',
              symbolSize: 10,
              label: {
                show: false
              },
              emphasis: {
                label: {
                  show: false
                }
              }
            }
          ],
          {
            name: 'min line on close',
            type: 'min',
            valueDim: 'close'
          },
          {
            name: 'max line on close',
            type: 'max',
            valueDim: 'close'
          }
        ]
      }
    },
    {
      name: 'MA5',
      type: 'line',
      data: calculateMA(5),
      smooth: true,
      lineStyle: {
        opacity: 0.5
      }
    },
    {
      name: 'MA10',
      type: 'line',
      data: calculateMA(10),
      smooth: true,
      lineStyle: {
        opacity: 0.5
      }
    },
    {
      name: 'MA20',
      type: 'line',
      data: calculateMA(20),
      smooth: true,
      lineStyle: {
        opacity: 0.5
      }
    },
    {
      name: 'MA30',
      type: 'line',
      data: calculateMA(30),
      smooth: true,
      lineStyle: {
        opacity: 0.5
      }
    }
  ]
};

if (option && typeof option === 'object') {
    myChart.setOption(option);
}

</script>
</body>
</html>
