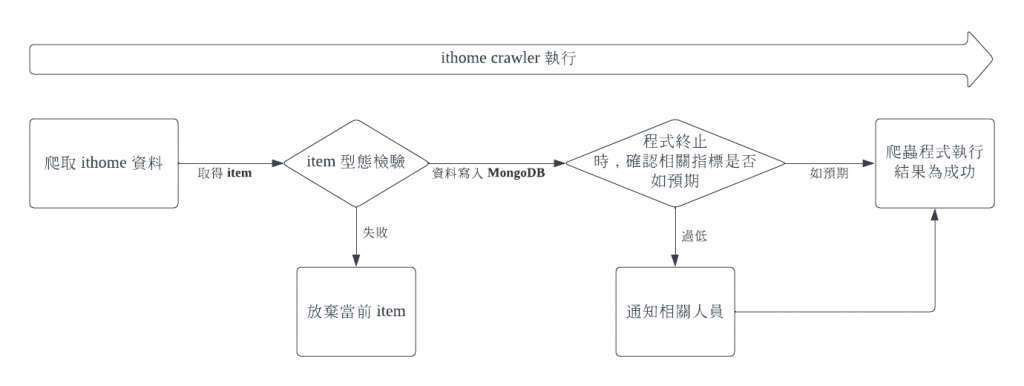
在這次我們的 source data 為第三方來源(爬蟲),往往因為網站的變動又或是被 ban IP 而無法確定資料有被正確爬取(包含資料筆數、欄位正確性)。這次我們並不會著重在如何優化爬蟲程式,而是重點討論檢驗資料正確性。因此今天主要處理資料品質的問題。
在資料由爬蟲程式拿到時,我們可以用 pydantic 進行初步的型態檢測,當 item 拿到的資料無法適配宣告的型態時,會在 console 拋出錯誤(程式不會停止)並同時放棄當前異常的 item 被寫入資料庫。
# src/item.py
class DataAttributeItem(pydantic.BaseModel):
    """data attribute"""
    crawl_datetime: datetime.datetime = datetime.datetime.now()

class IthomeUserInfoItem(DataAttributeItem):
    source: str = "ithome_user_info_item"
    user_id: int
    user_name: str
    ithome_level: str
    ithome_point: int
    user_viewed: int
    user_followed: int
    ask_question: int
    article: int
    answer: int
    invitation_answer: int
    best_answer: int
在爬蟲程式結束時,Scrapy 會產生一個摘要
[scrapy.statscollectors] INFO: Dumping Scrapy stats:
{'downloader/request_bytes': 171563,
 'downloader/request_count': 471,
 'downloader/request_method_count/GET': 471,
 'downloader/response_bytes': 6115445,
 'downloader/response_count': 471,
 'downloader/response_status_count/200': 471,
 'elapsed_time_seconds': 85.497271,
 'finish_reason': 'finished',
 'finish_time': datetime.datetime(2022, 9, 25, 16, 1, 33, 324185),
 'httpcompression/response_bytes': 24007335,
 'httpcompression/response_count': 471,
 'item_scraped_count': 391,
 'log_count/INFO': 30,
 'memusage/max': 91111424,
 'memusage/startup': 82763776,
 'request_depth_max': 3,
 'response_received_count': 471,
 'scheduler/dequeued': 471,
 'scheduler/dequeued/memory': 471,
 'scheduler/enqueued': 471,
 'scheduler/enqueued/memory': 471,
 'start_time': datetime.datetime(2022, 9, 25, 16, 0, 7, 826914)}
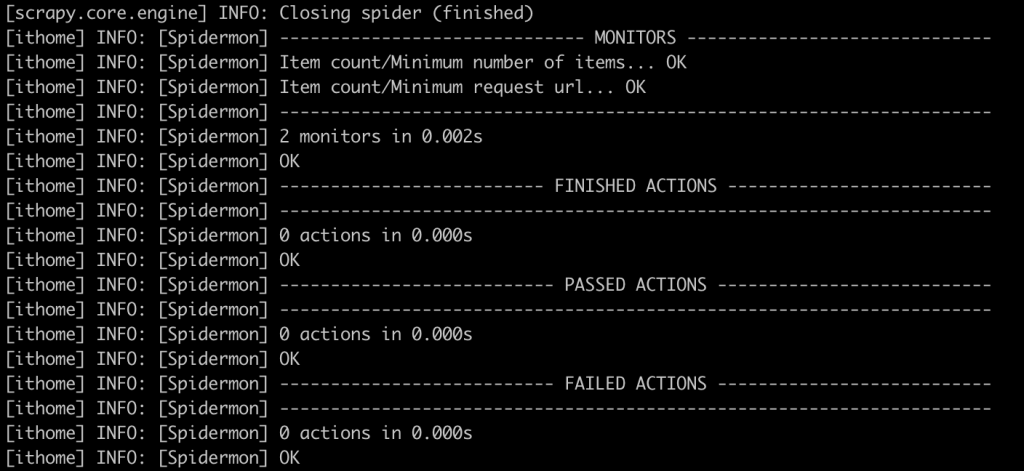
我們可以再訂下規則來判定此次程式是否如預期,例如爬蟲程式正確結束的條件是
可以依照實際需求修改量尺
則我們可以在 SPIDERMON_SPIDER_CLOSE_MONITORS 新增兩個對應的 monitor 行為
# src/monitor.py
@monitors.name('Item count')
class ItemCountMonitor(Monitor):

    @monitors.name('Minimum request url')
    def test_minimum_page_of_process(self):
        item_extracted = getattr(
            self.data.stats, 'response_received_count', 0)
        minimum_threshold = 1

        self.assertTrue(
            item_extracted >= minimum_threshold, msg=f'Ithome iron page crawl less than {minimum_threshold} page'
        )

    @monitors.name('Minimum number of items')
    def test_minimum_number_of_items(self):
        item_extracted = getattr(
            self.data.stats, 'item_scraped_count', 0)
        minimum_threshold = 0

        self.assertTrue(
            item_extracted >= minimum_threshold, msg=f'Extracted less than {minimum_threshold} items'
        )

class SpiderCloseMonitorSuite(MonitorSuite):

    monitors = [
        ItemCountMonitor,
    ]
    monitors_failed_actions = [
      CloseSpiderAction
    ]
所以當 Scrapy 摘要中的 item_scraped_count 小於 0 或是 response_received_count小於1,則可以在執行狀態中觀察到:
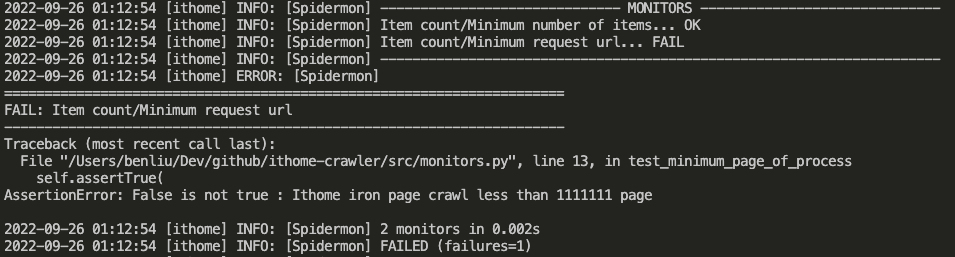
再來,可以藉由 monitors_failed_actions 做出 Action (如向 Slack 發出告警)
特別注意, monitor 項目沒有通過並不會讓程式的 return code 產生異常 ( > 0)
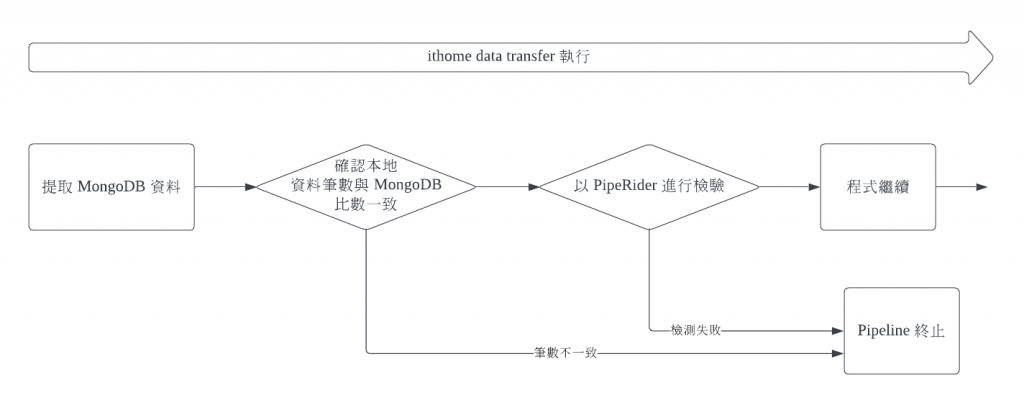
當我們將資料從 MongoDB 儲存到本地的 csv 後,我們會先確認 csv 的資料筆數與 MongoDB 的資料筆數一致
stage("Check mongo data"){
    steps{
        sh  '''
        MONGO_DATA_COUNT=$(python3 mongo_client.py -c ${DATA} count-data --contain-header)
        CSV_DATA_COUNT=$(cat output/${DATA}/${DATA}.csv|wc -l)
        echo "Mongo data count: ${MONGO_DATA_COUNT}"
        echo "CSV data count: ${CSV_DATA_COUNT}"
        if [ $CSV_DATA_COUNT != $CSV_DATA_COUNT ]; then exit 1; fi
        '''
    }
}
在確認筆數一致後,我們接著來檢測資料品質 (Data Quality)。此次會使用 InfuseAI 開源的 Data Quality Tool - PipeRider
我們可以簡單由 pip install piperider 即可進行 PipeRider 的安裝。
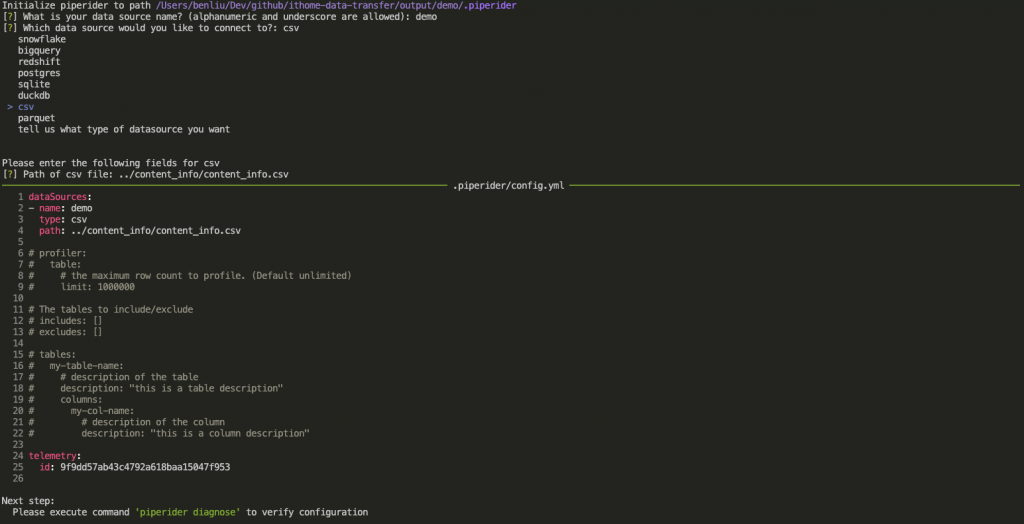
在一開始時,我們需要初始化 PipeRider 專案,依序宣吿
在完成設定檔的宣告後,會自動產生在當前路徑下生成 .piperider 資料夾,並且會依據方才的宣告內容產生對應的 config.yaml
piperider init
# .piperider/config.yaml

dataSources:
- name: demo
  type: csv
  path: ../content_info/content_info.csv

# profiler:
#   table:
#     # the maximum row count to profile. (Default unlimited)
#     limit: 1000000

# The tables to include/exclude
# includes: []
# excludes: []

# tables:
#   my-table-name:
#     # description of the table
#     description: "this is a table description"
#     columns:
#       my-col-name:
#         # description of the column
#         description: "this is a column description"

telemetry:
  id: 9f9dd57ab43c4792a618baa15047f953
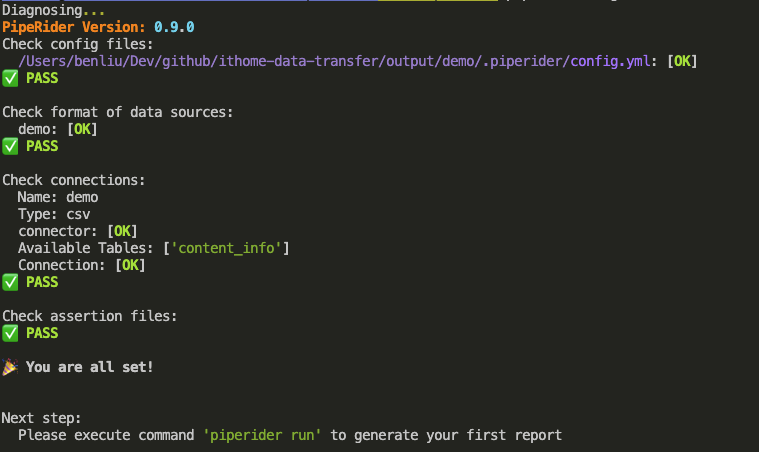
再來我們來確認設定檔的正確性,以及資料來源的連線測試
piperider diagnose
接著,我們可以開始檢測我們的資料品質
piperider run
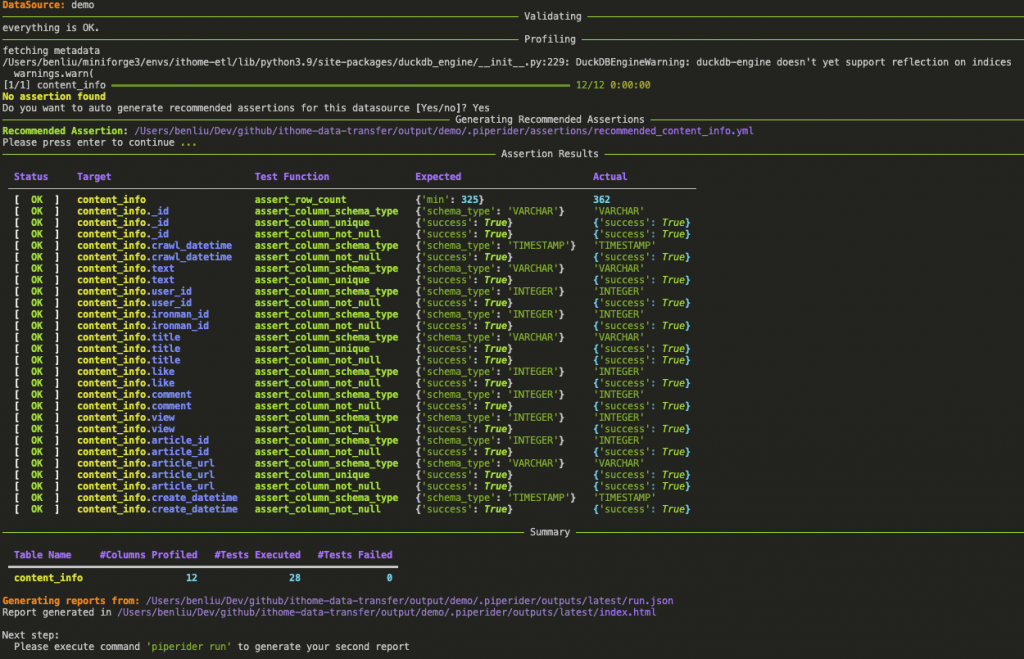
更多細部參數調整可以看官網介紹
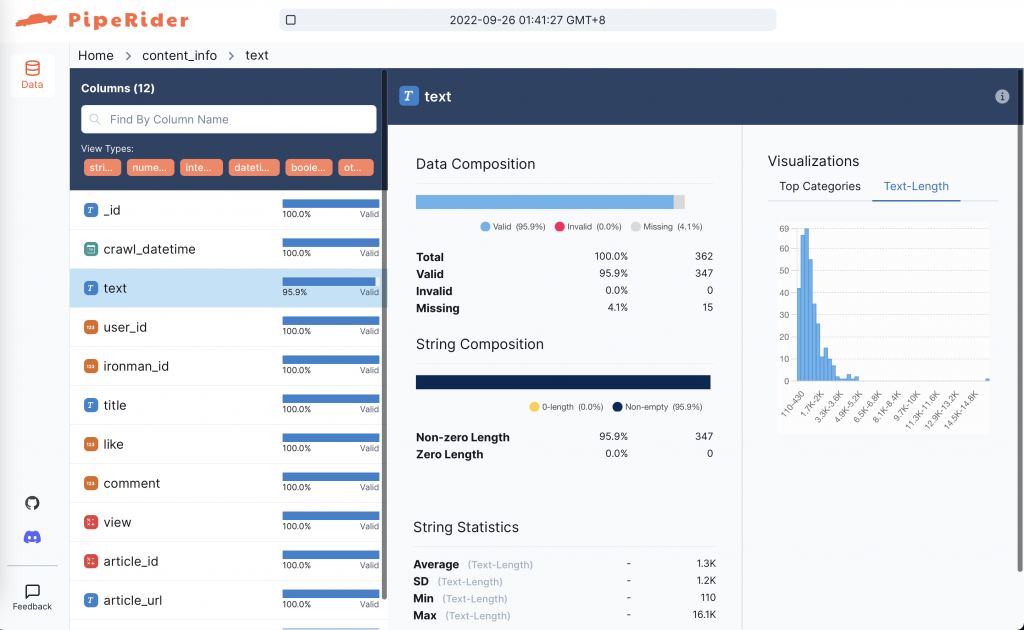
在執行結束後,PipeRider 會產生一個分析報告(靜態 HTML)
這邊我們來假設一種錯誤情況: 在 recommended_content_info.yaml 的測試項目下,_id 的資料應為唯一值,所以我們故意讓其中兩筆的 _id 重複 20152012-5491-10298343
# .piperider/assertions/recommended_content_info.yaml
columns:
_id:  # Column Name
  # Test Cases for Column
  tests:
  - name: assert_column_schema_type
    assert:
      schema_type: VARCHAR
    tags:
    - RECOMMENDED
  - name: assert_column_unique
    tags:
    - RECOMMENDED
  - name: assert_column_not_null
    tags:
    - RECOMMENDED

讓我們再次執行 piperider run 進行資料測試,這時我們可以在 Terminal 看到 content_info._id 的測試項目會出現 [Failed]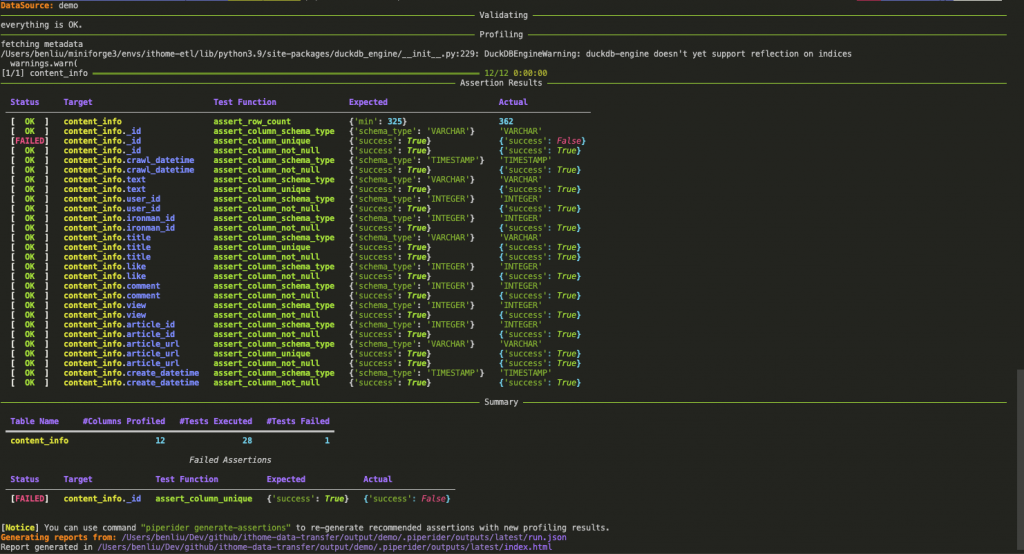
目前並未看到 PipeRider 支援可以在 Terminal 執行下拋出異常訊號(return code != 0)用以判斷測試結果是否異常。但是我們可以觀察到 PipeRider 的測試相關結果資料均會寫在 .piperider/outputs/latest/run.json 中,所以可以利用一個 python script 用以解析 run.json 內容,幫助我們判斷測試結果狀態。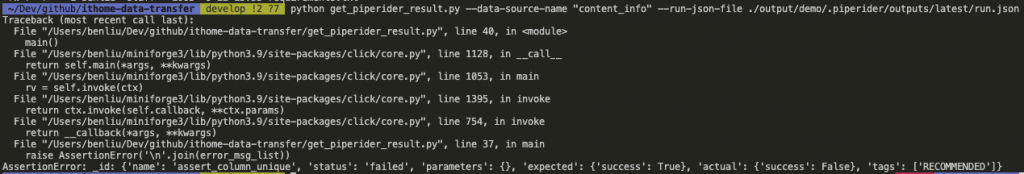
@click.command()
@click.option('--run-json-file', type=str, default='')
@click.option('--data-source-name', type=str, required=True)
def main(data_source_name: str, run_json_file: str) -> None:
    if not run_json_file:
        run_json_file = f'./output/{data_source_name}/.piperider/outputs/latest/run.json'
    run_json_data = json.load(open(run_json_file))
    test_result = run_json_data['tables'][data_source_name]['piperider_assertion_result']['columns']
    TEST_RESULT='succeed'
    error_msg_list = []

    for col, result in test_result.items():
        for test_item in result:
            if test_item['status'] != 'passed':
                error_msg_list.append(f'{col}: {test_item}')
                TEST_RESULT='failed'

    if TEST_RESULT == 'failed':
        raise AssertionError('\n'.join(error_msg_list))

if __name__ == "__main__":
    main()
下面為 Jenkinsfile 串接 PipeRider 的範例 stage 寫法
DATA = [content_info, user_info]
請參考昨日 matrix 寫法一起服用
stage("Check data quality"){
    steps{
        sh """
        cd output/${DATA} && piperider run
        """

        sh "python3 get_piperider_result.py ----data-source-name ${DATA}"
    }
}
......
post {
    always{
        archiveArtifacts artifacts: 'output/**', followSymlinks: false
    }
}
......
今天我們就在爬蟲程式 (Scrapy) 、Local 與 PipeRider 中進行不同面向的資料品質檢測。
Scrapy 是一個 python 的爬蟲框架,上手起來可能沒那麼容易,但是功能強大適合在 Production 場景使用,所以非常推薦大家去看看。
PipeRider 是一個 Python Base 的 Data Quality 工具 ,操作簡易也可以簡單用 yaml 擴充測試項目、Terminal 介面做的非常 fancy~ 非常推薦大家用來玩玩看,來更了解自己的資料。
https://docs.scrapy.org/en/latest/intro/tutorial.html
https://spidermon.readthedocs.io/en/latest/monitors.html
https://github.com/scrapinghub/spidermon/blob/master/examples/tutorial/tutorial/actions.py
https://www.piperider.io
https://blog.infuseai.io/adding-data-observability-and-alerts-to-your-data-pipeline-is-easier-than-you-think-4e005daca55b