分群的目的為讓群內的總變異最小,群間的總變異最大,因此在執行分群任務時,如何找到恰當的分群數目(k)是一個重要的課題。
在衡量分群數量時,可使用手肘法(Elbow Method)或平均輪廓/平均側影法(Average Silhouette Method)。
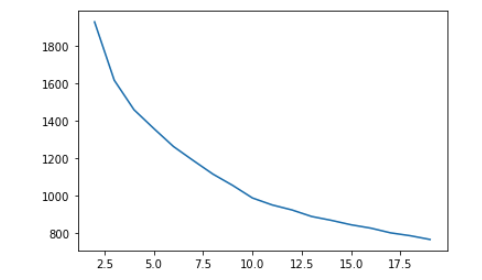
手肘法(Elbow Method)針對所有資料點和各群中心距離的平方誤差和(Sum of Squared Error, SSE)進行計算,當k=1時,SSE為最大,隨著k的增加,SSE會逐漸下降,而找到最適合的分群(k)時,SSE的下降斜率會趨於平緩。
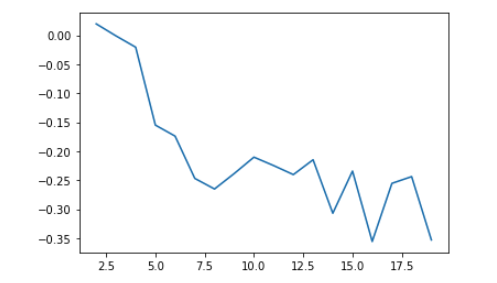
輪廓係數/側影係數(The Silhouette Index)為根據每個資料點的分散以及聚合來衡量分群的結果。
方法:

kmeans()$tot.withinss的數值為within-clusters sum of squareslibrary(purrr)
#用較小的資料量進行
subset_testing <- testing[sample(1:length(testing$Activity),10000),]
wss <- function(k){kmeans(subset_testing[,1:12],k,nstart = 20)$tot.withinss}
k.value <- 1:20
wss_value <- map_dbl(k.value,wss)
plot(k.value,wss_value,type= 'l',xlab = 'Number of cluster K',ylb = 'Total within-clusters sum of squares')

kMeans().fit_predict().inertia_的數值為within-clusters sum of squaresimport matplotlib.pyplot as plt
## 用較小的資料量進行
index = list(range(0,(X_test.shape[0])-1))
sample_index = random.sample(index, 10000)
wss_avg = []
for i in range(2,20):
kmeans_fit = cluster.KMeans(n_clusters = i,algorithm="elkan").fit(X_test[sample_index,:])
kmeans_fit.fit_predict(X_test[sample_index,:])
wss_avg.append(kmeans_fit.inertia_)
plt.plot(range(2,20), wss_avg)

接續前一天的Kmeans模型,實作分群衡量。
cluster套件中的silhouette## 用較小的資料量
## subset_testing[,13]為activity
subset_testing <- testing[sample(1:length(testing$Activity),10000),]
silhouette_score <- function(k){
km <- kmeans(subset_testing[,1:12], centers = k, nstart=25)
ss <- silhouette(km$cluster, dist(subset_testing[,13]))
mean(ss[, 3])
}
k <- 2:20
avg_sil <- sapply(k, silhouette_score)
plot(k, type='b', avg_sil, xlab='Number of clusters', ylab='Average Silhouette Scores', frame=FALSE)

sklearn.metrics套件中的silhouette_scorefrom sklearn import cluster
from sklearn.metrics import silhouette_score
# KMeans
pred_kmean = cluster.KMeans(n_clusters = 13,algorithm="elkan")
pred_kmean.fit_predict(X_test)
pred_labels = pred_kmean.labels_
score = silhouette_score(X_test, pred_labels, metric='euclidean')
print('Silhouetter Score: %.3f' % score)
## Silhouetter Score: 0.244
使用不同的K,計算silhouette score
import matplotlib.pyplot as plt
## 減少資料量
index = list(range(0,(X_test.shape[0])-1))
sample_index = random.sample(index, 10000)

silhouette_avg = []
for i in range(2,20):
    kmeans_fit = cluster.KMeans(n_clusters = i,algorithm="elkan").fit(X_test[sample_index,:])
    kmeans_fit.fit_predict(X_test[sample_index,:])
    silhouette_avg.append(silhouette_score(Y_test.iloc[sample_index].array.reshape(-1, 1), kmeans_fit.labels_,metric='euclidean'))
plt.plot(range(2,20), silhouette_avg)

