前兩篇介紹了 Kiali 工具,裡面有不同的 GUI 介面將 Application 可視化,雖然方便,但 Kiali 的介面都是固定的,如果想要把所需資訊都塞到同個頁面要怎麼做?本篇要介紹的 Grafana 就能幫助你客製化自己的 Dashboard。

Grafana 是一個開源軟體,能夠將各種資料做成監控儀表板,支援多種資料來源,以及提供豐富的面板選擇,協助我們將資料視覺化。
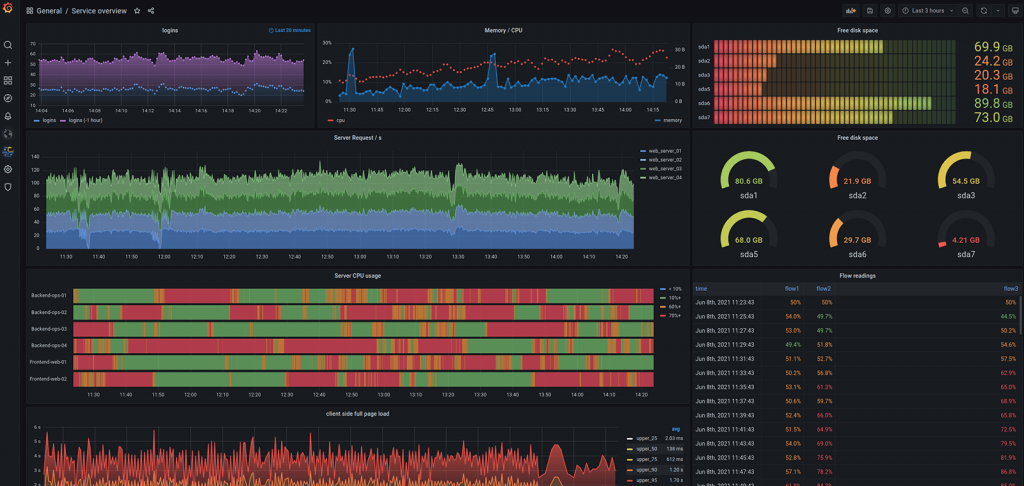
Grafana Dashboard 介面,圖片取至 grafana.com
有接觸過 Prometheus 的人應該會聽到與 Grafana 結合的 Use Case,就是因為 Prometheus 預設的 GUI 功能不足,需要 Grafana 這種支援豐富圖表的工具幫助我們可視化 Metrics 資訊。
本篇參考 Visualizing Metrics with Grafana ,使用 Grafana 前需先在 Istio 環境準備好 Prometheus ,細節可參考 Day18 的教學,接著就可以用官方提供的 grafana.yaml 安裝。
kubectl apply -f https://raw.githubusercontent.com/istio/istio/release-1.15/samples/addons/grafana.yaml
安裝方式參考 Istio - Grafana
Grafana 會安裝到 istio-system Namespace,檢查一下是否安裝成功。
kubectl get pods -n <namespace> 查看 Pods 運行狀況kubectl get pods -n istio-system
(輸出結果)
NAME                                   READY   STATUS    RESTARTS   AGE
grafana-96dd4774d-ftvm5                1/1     Running   0          3m28s
istio-ingressgateway-d54ff84fc-fpts7   1/1     Running   0          15d
istiod-68df67c57b-krrdx                1/1     Running   0          15d
kiali-575f548888-grcxs                 1/1     Running   0          2d
prometheus-6549d6bdcc-kxgsj            2/2     Running   0          3d4h
Grafana Pod 的 Status 為 Running 代表部署成功
kubectl port-forward 將流量打入 Grafanakubectl port-forward -n istio-system svc/grafana 8083:3000
http://127.0.0.1:8083
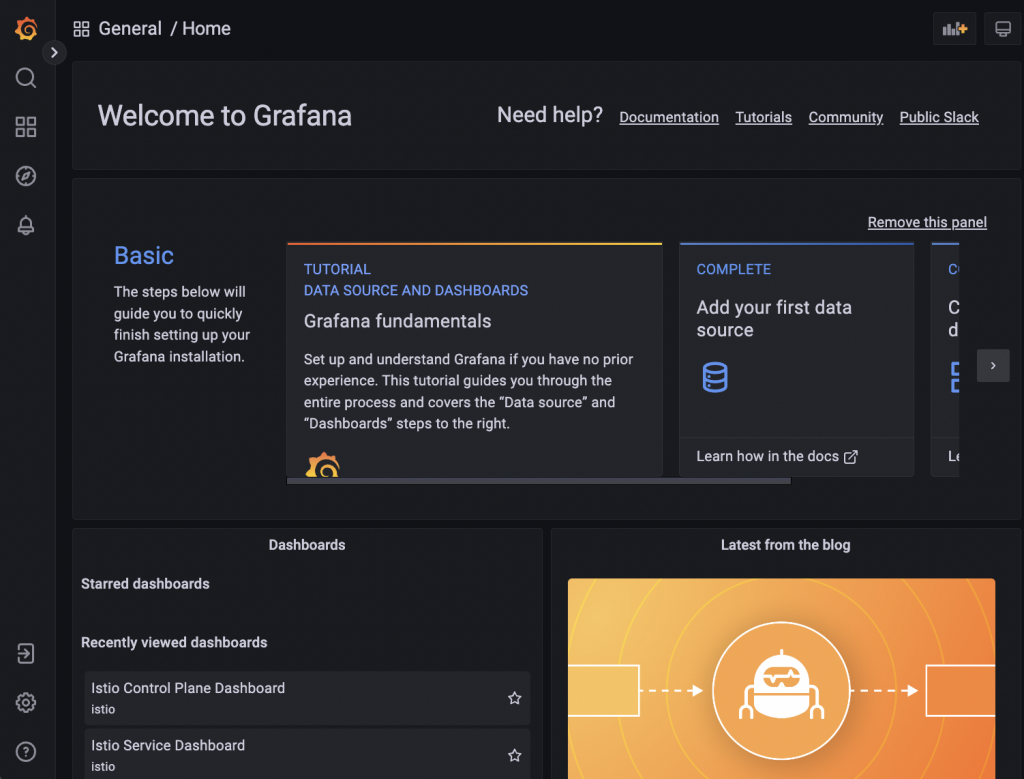
在瀏覽器即可看到 Grafana 的 Home 頁面。
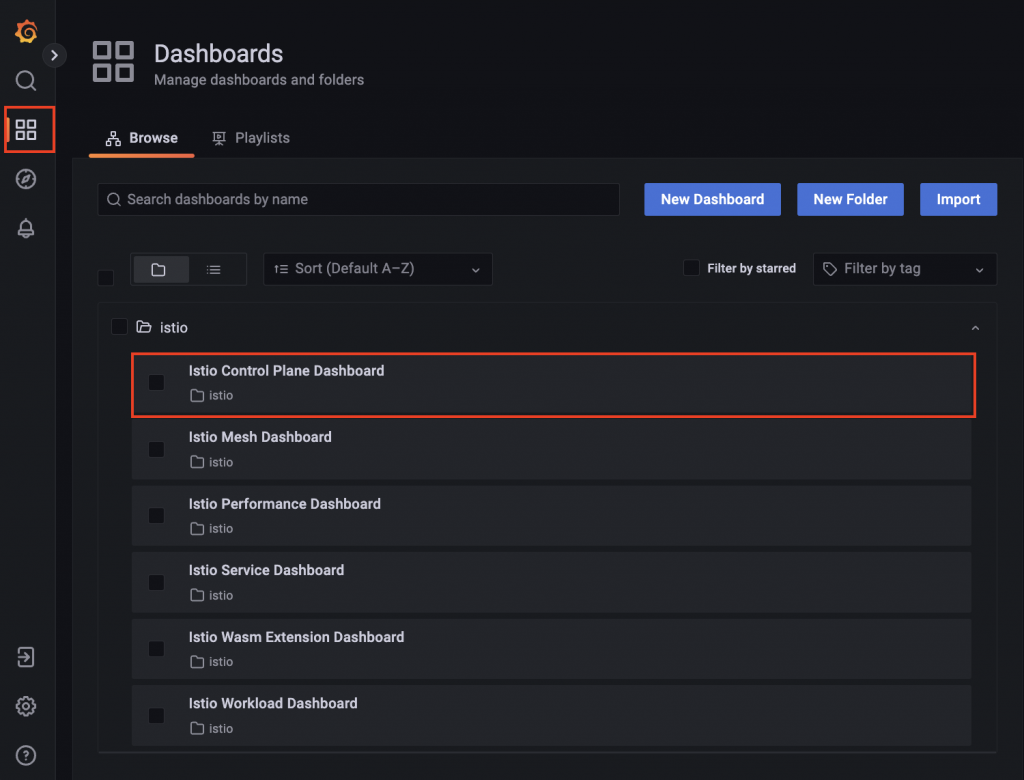
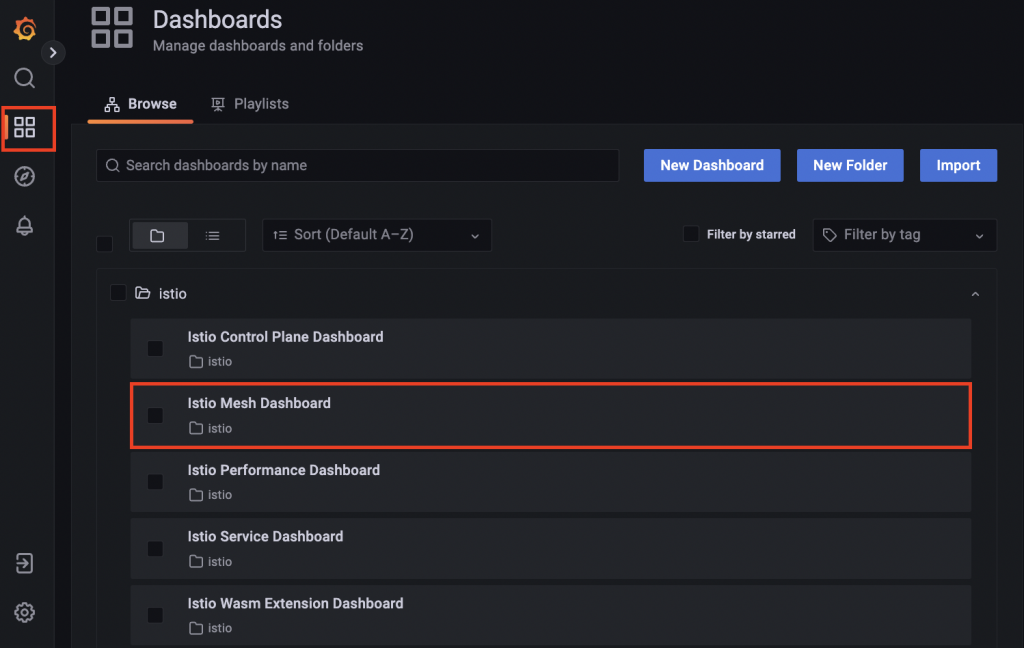
因為我們是使用 Istio 提供的 Yaml 檔案安裝 Grafana,預設會先建立幾個 Dashboard 如下
接著就進入到 Dashboard,看看到底會顯示哪些資訊吧!
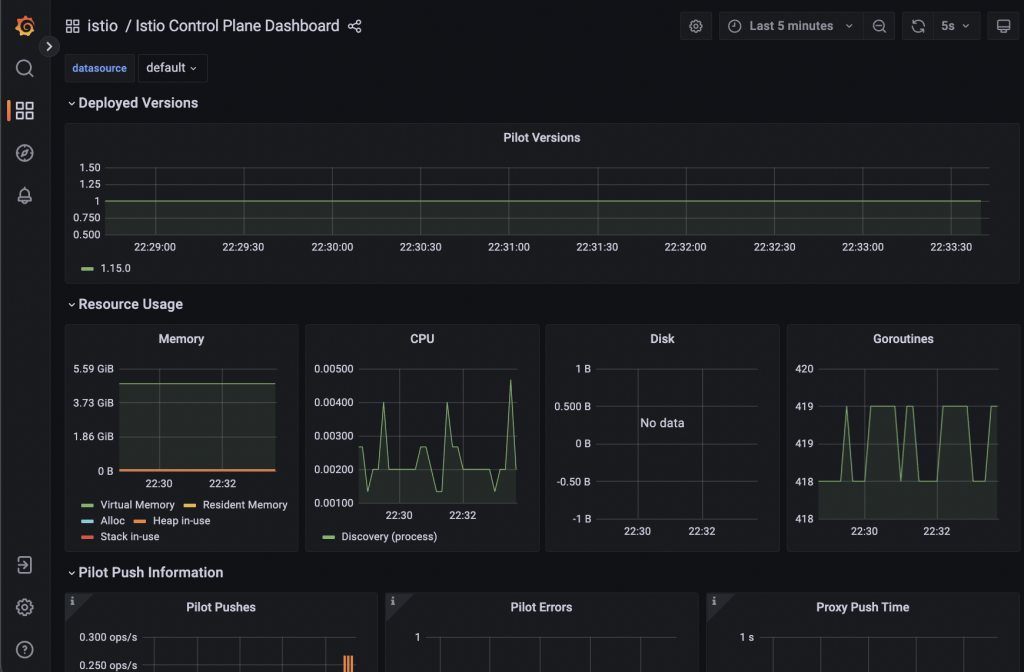
Dashboards,接著點選 Istio Control Plane Dashboard
在 Istio Control Plane Dashboard 會有 Control Plane 的資料如 CPU 及 Memory 使用量。
接著我們來看看跟 Service 有關的 Dashboard,需要先打入流量讓 Prometheus 蒐集 Metrics 才有資料可以顯示。
kubectl port-forward 將本機流量轉移到 Productagekubectl port-forward svc/productpage 8080:9080
while true; do curl -s 127.0.0.1:8080/productpage | grep reviews-v ; sleep 2; done
完成後就可以回到 Grafana 查看 Dashboard。
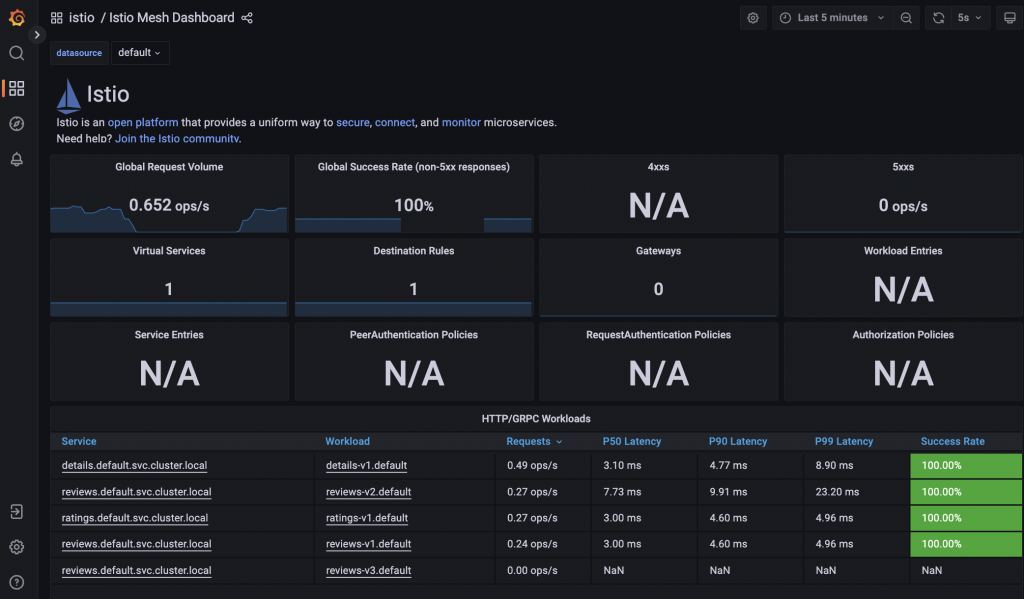
Dashboards,接著點選 Istio Mesh Dashboard
在 Istio Mesh Dashboard 可看到所有 Services 的資料,如 Latency 及連線成功比率。
還有其他預設的 Istio Dashboard,可以自己嘗試看看。
本篇簡單介紹了 Grafana 並透過 Istio 預設 Dashboard 了解有哪些資料呈現方式,下一篇會介紹如何在 Grafana 可視化特定資料,讓我們做出屬於自己的 Dashboard。